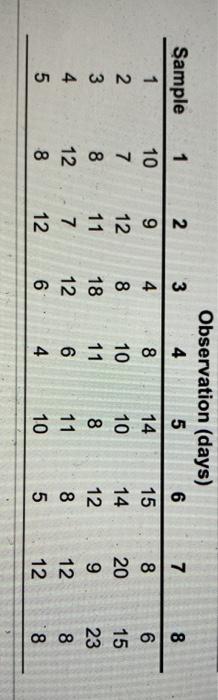
Question: 1 7 8 8 ample 1 2 3 4 5 10 7 8 12 8 2 9 12 11 7 12 3 4 8 18

1 7 8 8 ample 1 2 3 4 5 10 7 8 12 8 2 9 12 11 7
1 7 8 8 ample 1 2 3 4 5 10 7 8 12 8 2 9 12 11 7 12 3 4 8 18 12 Observation (days) 4 5 6 8 14 15 10 10 14 11 8 12 6 11 8 4 10 5 20 9 12 12 6 15 23 8 8 Factors for calculating three-sigma limits for the x-chart and R-chart. Factor for LCL for R-Chart (D3) Size of Sample Factor for UCL and LCL (n) for X-chart (A2) 2 1.880 3 1.023 4 0.729 5 0.577 6 0.483 7 0.419 8 0.373 9 0.337 10 0.308 0 0 0 0 0 0.076 0.136 0.184 0.223 Factor for UCL for R-Chart (D4) 3.267 2.575 2.282 2.115 2.004 1.924 1.864 1.816 1.777 c. Construct an R- and an x-chart for this process. Set up the R-chart by specifying the three-sigma control limits below. The UCLR equals 14.23 and the LCLR equals 6.05. (Enter your responses rounded to two decimal places.)

Step by Step Solution

There are 3 Steps involved in it

1 Expert Approved Answer
Step: 1 Unlock blur-text-image
Question Has Been Solved by an Expert!

Get step-by-step solutions from verified subject matter experts

Step: 2 Unlock
Step: 3 Unlock

Students Have Also Explored These Related General Management Questions!