

Question: 1. (8 points) Figure 1 depicts 2 clusters generated at the ith iteration of Lloyd's algorithm for k-means clustering. 10 9 5 4 3 2
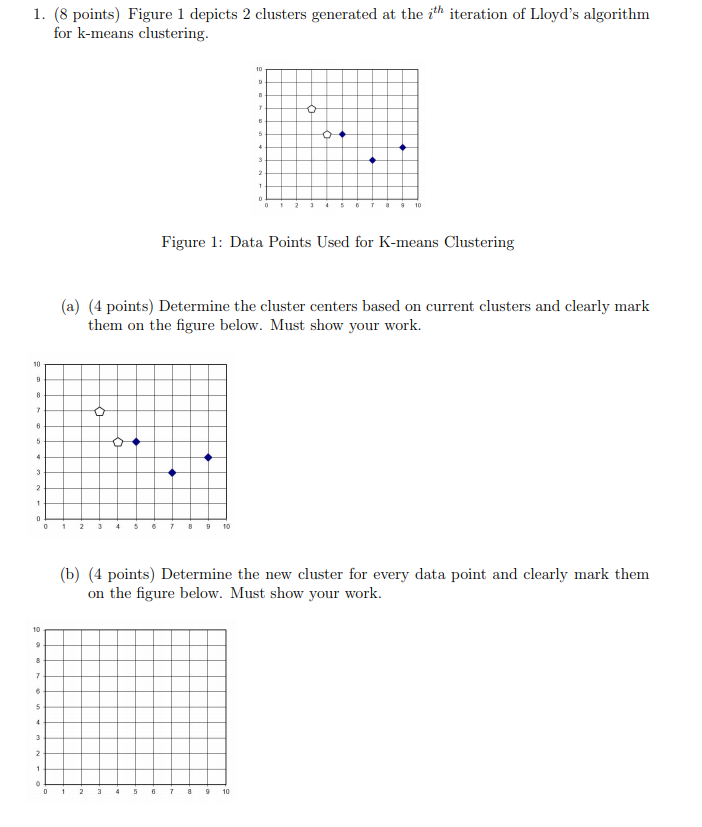
1. (8 points) Figure 1 depicts 2 clusters generated at the ith iteration of Lloyd's algorithm for k-means clustering. 10 9 5 4 3 2 10 Figure 1: Data Points Used for K-means Clustering (a) (4 points) Determine the cluster centers based on current clusters and clearly mark them on the figure below. Must show your work. 10 9 B 7 6 5 6 3 . 2 1 0 0 1 2 7 9 10 (b) (4 points) Determine the new cluster for every data point and clearly mark them on the figure below. Must show your work. 10 9 7 5 4 3 2 1 O 0 1 2 4 7 8 10 1. (8 points) Figure 1 depicts 2 clusters generated at the ith iteration of Lloyd's algorithm for k-means clustering. 10 9 5 4 3 2 10 Figure 1: Data Points Used for K-means Clustering (a) (4 points) Determine the cluster centers based on current clusters and clearly mark them on the figure below. Must show your work. 10 9 B 7 6 5 6 3 . 2 1 0 0 1 2 7 9 10 (b) (4 points) Determine the new cluster for every data point and clearly mark them on the figure below. Must show your work. 10 9 7 5 4 3 2 1 O 0 1 2 4 7 8 10
Step by Step Solution
There are 3 Steps involved in it

Get step-by-step solutions from verified subject matter experts