

Question: 1 A B D E F G H J K M N 2 3 Date GE 4 5 Monthly Returns 8/1/1997 -0.113772 -0.05414 9/2/1997
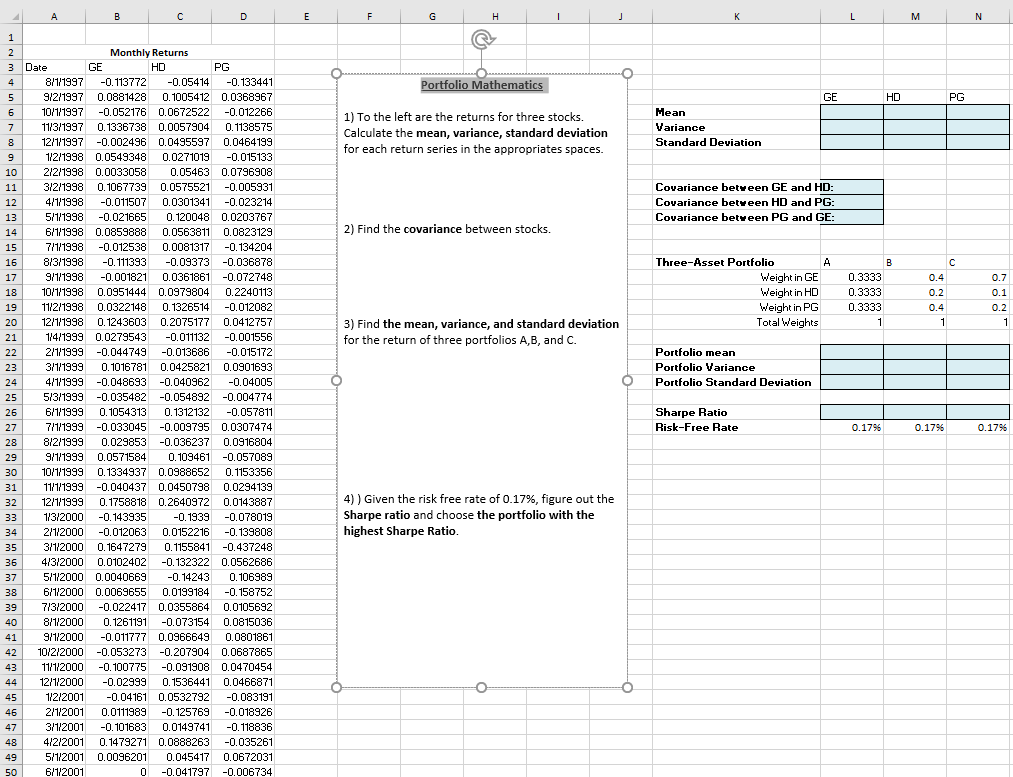
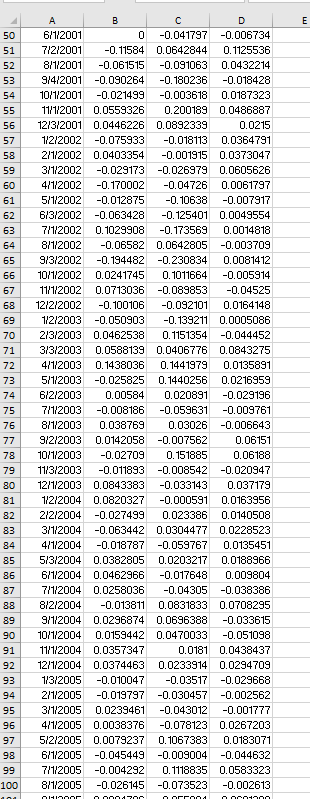
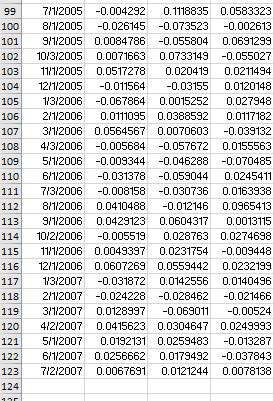
1 A B D E F G H J K M N 2 3 Date GE 4 5 Monthly Returns 8/1/1997 -0.113772 -0.05414 9/2/1997 0.0881428 0.1005412 HD PG -0.133441 0.0368967 6 10/1/1997 -0.052176 0.0672522 -0.012266 7 8 9 10 11 11/3/1997 0.1336738 0.0057904 0.1138575 12/1/1997 -0.002496 0.0495597 0.0464199 1/2/1998 0.0549348 0.0271019 -0.015133 2/2/1998 0.0033058 0.05463 0.0796908 3/2/1998 0.1067739 0.0575521 -0.005931 Portfolio Mathematics 1) To the left are the returns for three stocks. Calculate the mean, variance, standard deviation for each return series in the appropriates spaces. Mean Variance Standard Deviation GE HD PG 12 4/1/1998 -0.011507 0.0301341 -0.023214 13 14 15 16 17 18 19 20 21 22 5/1/1998 -0.021665 0.120048 0.0203767 6/1/1998 0.0859888 0.0563811 0.0823129 7/1/1998 -0.012538 0.0081317 -0.134204 8/3/1998 -0.111393 -0.09373 -0.036878 9/1/1998 -0.001821 0.0361861 -0.072748 10/1/1998 0.0951444 0.0979804 0.2240113 11/2/1998 0.0322148 0.1326514 -0.012082 12/1/1998 0.1243603 0.2075177 0.0412757 1/4/1999 0.0279543 -0.011132 -0.001556 2/1/1999 -0.044749 -0.013686 -0.015172 Covariance between GE and HD: Covariance between HD and PG: Covariance between PG and GE: 2) Find the covariance between stocks. Three-Asset Portfolio A B C Weight in GE 0.3333 0.4 0.7 Weight in HD 0.3333 0.2 0.1 Weight in PG 0.3333 0.4 3) Find the mean, variance, and standard deviation for the return of three portfolios A,B, and C. Total Weights 1 1 0.2 1 Portfolio mean 23 24 25 3/1/1999 0.1016781 0.0425821 0.0901693 4/1/1999 -0.048693 -0.040962 -0.04005 5/3/1999 -0.035482 -0.054892 -0.004774 26 6/1/1999 0.1054313 0.1312132 -0.057811 Portfolio Variance Portfolio Standard Deviation Sharpe Ratio 27 7/1/1999 -0.033045 -0.009795 0.0307474 Risk-Free Rate 0.17% 0.17% 0.17% 28 8/2/1999 0.029853 -0.036237 0.0916804 29 9/1/1999 0.0571584 0.109461 -0.057089 30 10/1/1999 0.1334937 0.0988652 0.1153356 31 32 11/1/1999 -0.040437 0.0450798 12/1/1999 0.1758818 0.2640972 0.0294139 33 1/3/2000 -0.143935 -0.1939 0.0143887 -0.078019 34 2/1/2000 -0.012063 0.0152216 -0.139808 4)) Given the risk free rate of 0.17%, figure out the Sharpe ratio and choose the portfolio with the highest Sharpe Ratio. 35 3/1/2000 0.1647279 0.1155841 -0.437248 36 37 38 39 40 41 42 43 9/1/2000 -0.011777 0.0966649 10/2/2000 -0.053273 -0.207904 0.0687865 11/1/2000 -0.100775 -0.091908 0.0470454 4/3/2000 0.0102402 -0.132322 0.0562686 5/1/2000 0.0040669 -0.14243 0.106989 6/1/2000 0.0069655 0.0199184 -0.158752 7/3/2000 -0.022417 0.0355864 0.0105692 8/1/2000 0.1261191 -0.073154 0.0815036 0.0801861 44 45 46 47 48 4/2/2001 49 12/1/2000 -0.02999 0.1536441 0.0466871 1/2/2001 -0.04161 0.0532792 -0.083191 2/1/2001 0.0111989 -0.125769 -0.018926 3/1/2001 -0.101683 0.0149741 -0.118836 0.1479271 0.0888263 -0.035261 5/1/2001 0.0096201 0.045417 0.0672031 50 6/1/2001 0 -0.041797 -0.006734 50 51 52 53 54 8/1/2001 -0.061515 9/4/2001 -0.090264 10/1/2001 -0.021499 6/1/2001 B 0 -0.041797 7/2/2001 -0.11584 0.0642844 D -0.006734 0.1125536 -0.091063 0.0432214 -0.180236 -0.018428 -0.003618 0.0187323 55 11/1/2001 0.0559326 0.200189 0.0486887 56 57 58 59 60 61 62 63 64 65 66 12/3/2001 0.0446226 0.0892339 1/2/2002 -0.075933 -0.018113 0.0364791 2/1/2002 0.0403354 -0.001915 0.0373047 3/1/2002 -0.029173 -0.026979 0.0605626 4/1/2002 -0.170002 -0.04726 0.0061797 5/1/2002 -0.012875 -0.10638 -0.007917 6/3/2002 -0.063428 -0.125401 0.0049554 7/1/2002 0.1029908 -0.173569 0.0014818 8/1/2002 -0.06582 0.0642805 -0.003709 9/3/2002 -0.194482 -0.230834 0.0081412 10/1/2002 0.0241745 0.1011664 0.0215 -0.005914 67 11/1/2002 0.0713036 -0.089853 -0.04525 68 12/2/2002 -0.100106 -0.092101 0.0164148 69 1/2/2003 -0.050903 -0.139211 0.0005086 70 71 72 2/3/2003 0.0462538 3/3/2003 0.0588139 0.0406776 0.0843275 4/1/2003 0.1438036 0.1441979 0.0135891 0.1151354 -0.044452 73 5/1/2003 -0.025825 0.1440256 0.0216959 74 6/2/2003 0.00584 0.020891 -0.029196 75 7/1/2003 -0.008186 -0.059631 -0.009761 76 8/1/2003 0.038769 0.03026 -0.006643 77 9/2/2003 0.0142058 -0.007562 0.06151 78 10/1/2003 -0.02709 0.151885 0.06188 79 11/3/2003 -0.011893 -0.008542 -0.020947 80 12/1/2003 0.0843383 -0.033143 0.037179 81 82 83 84 85 86 0.0163956 1/2/2004 0.0820327 -0.000591 2/2/2004 -0.027499 0.023386 0.0140508 3/1/2004 -0.063442 0.0304477 0.0228523 4/1/2004 -0.018787 -0.059767 0.0135451 5/3/2004 0.0382805 0.0203217 0.0188966 0.009804 87 88 6/1/2004 0.0462966 -0.017648 7/1/2004 0.0258036 -0.04305 8/2/2004 -0.013811 0.0831833 0.0708295 -0.038386 89 9/1/2004 0.0296874 0.0696388 -0.033615 90 10/1/2004 0.0159442 0.0470033 -0.051098 91 11/1/2004 0.0357347 0.0181 0.0438437 92 12/1/2004 0.0374463 0.0233914 0.0294709 93 1/3/2005 -0.010047 -0.03517 -0.029668 94 2/1/2005 -0.019797 -0.030457 -0.002562 95 3/1/2005 0.0239461 -0.043012 -0.001777 4/1/2005 0.0038376 -0.078123 0.0267203 96 97 5/2/2005 0.0079237 0.1067383 0.0183071 98 99 100 6/1/2005 -0.045449 -0.009004 -0.044632 7/1/2005 -0.004292 0.1118835 0.0583323 8/1/2005 -0.026145 -0.073523 -0.002613 OHIO E 99 7/1/2005 -0.004292 100 8/1/2005 101 9/1/2005 0.1118835 0.0583323 102 10/3/2005 -0.026145 -0.073523 -0.002613 0.0084786 0.0084786 -0.055804 0.0691299 0.0071663 0.0733149 -0.055027 103 104 11/1/2005 0.0517278 0.020419 0.0211494 12/1/2005 -0.011564 -0.03155 0.0120148 105 0.027948 106 107 108 109 110 111 112 113 114 115 116 117 118 119 120 121 122 123 124 0.0117182 1/3/2006 -0.067864 0.0015252 2/1/2006 0.0111095 0.0388592 3/1/2006 0.0564567 0.0070603 -0.039132 4/3/2006 -0.005684 -0.057672 0.0155563 5/1/2006 -0.009344 -0.046288 -0.070485 6/1/2006 -0.031378 -0.059044 0.0245411 7/3/2006 -0.008158 -0.030736 0.0163938 8/1/2006 0.0410488 -0.012146 0.0965413 9/1/2006 0.0429123 0.0604317 0.0013115 10/2/2006 -0.005519 0.028763 0.0274698 11/1/2006 0.0049397 0.0231754 -0.009448 12/1/2006 0.0607269 0.0559442 0.0232199 1/3/2007 -0.031872 0.0142556 0.0140496 2/1/2007 -0.024228 -0.028462 -0.021466 3/1/2007 0.0128997 -0.069011 4/2/2007 0.0415623 0.0304647 0.0249993 5/1/2007 0.0192131 0.0259483 -0.013287 6/1/2007 0.0256662 -0.00524 0.0256662 0.0179492 -0.037843 7/2/2007 0.0067691 0.0121244 0.0078138 135
Step by Step Solution
There are 3 Steps involved in it

Get step-by-step solutions from verified subject matter experts