

Question: Part II: Use the data (returns) from project 01 and calculated for the following equal weighted portfolios: 1) Wal-Mart and GE ID) Wal-Mart and Apple
![returns (E[R]) of each equal weighted portfolio c) Standard deviation of each](https://dsd5zvtm8ll6.cloudfront.net/si.experts.images/questions/2024/10/66fe19c02f534_76766fe19bfb8981.jpg)
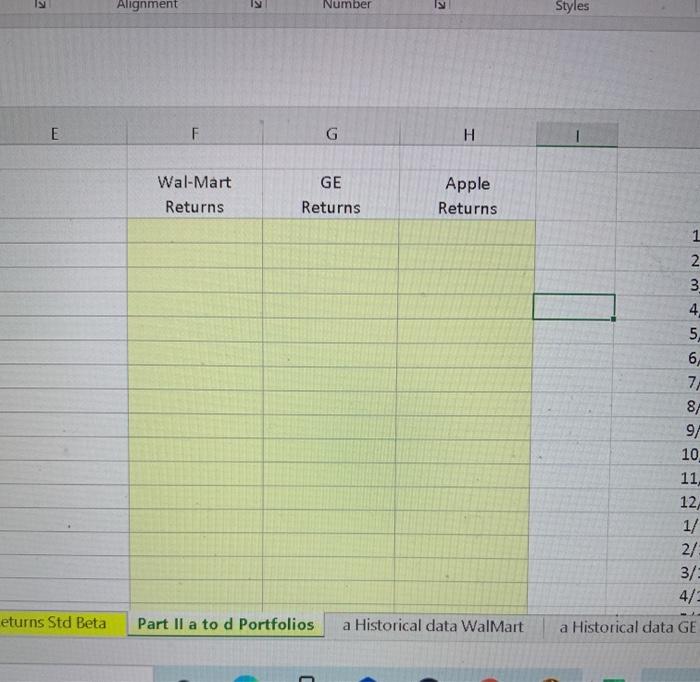
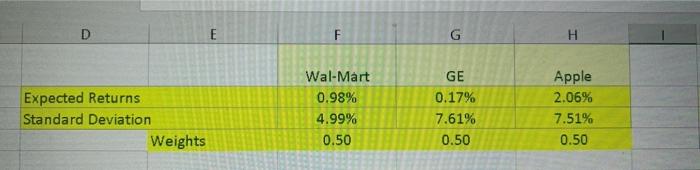


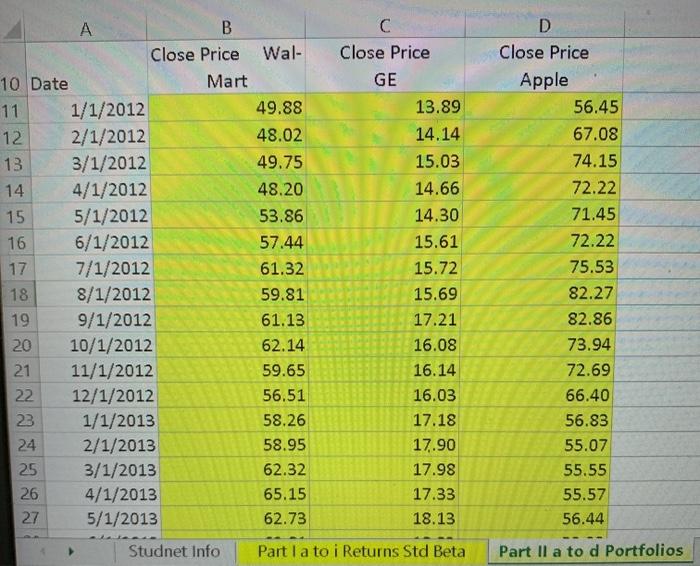
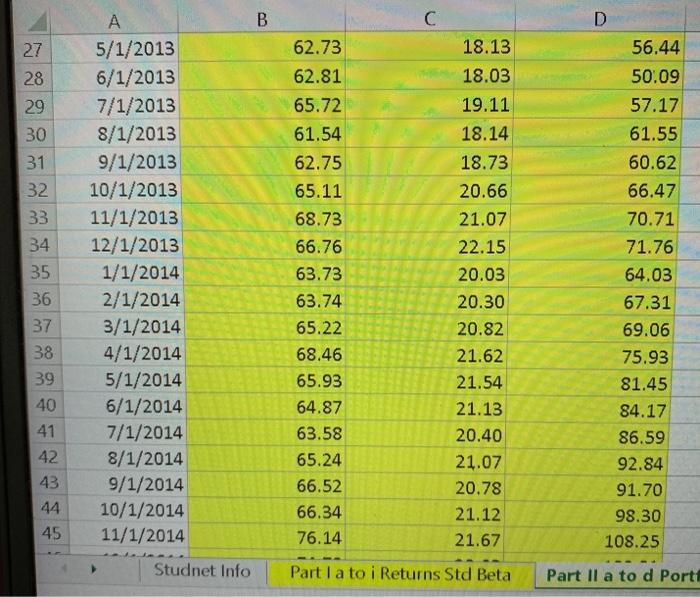
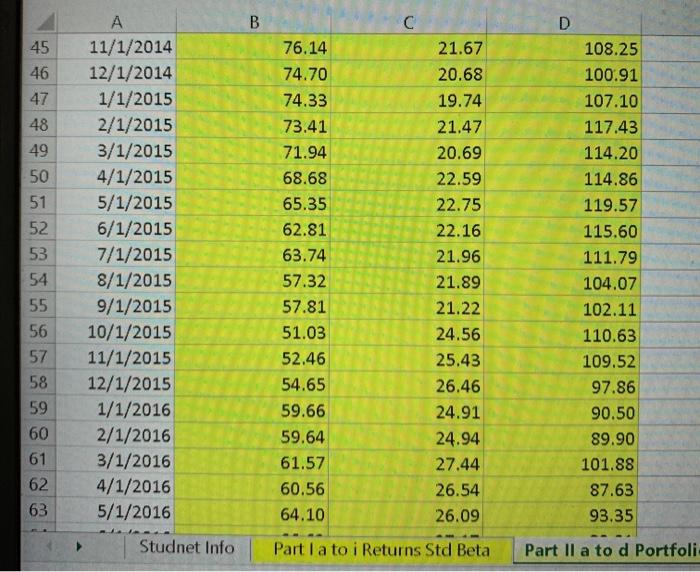
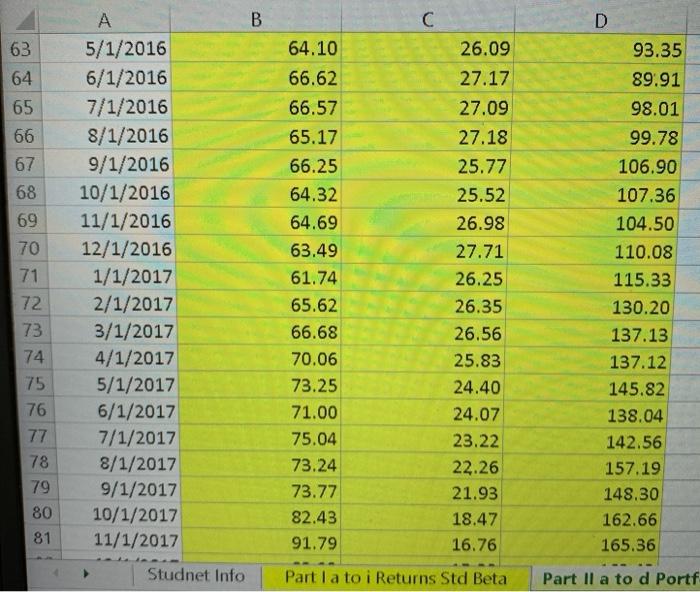
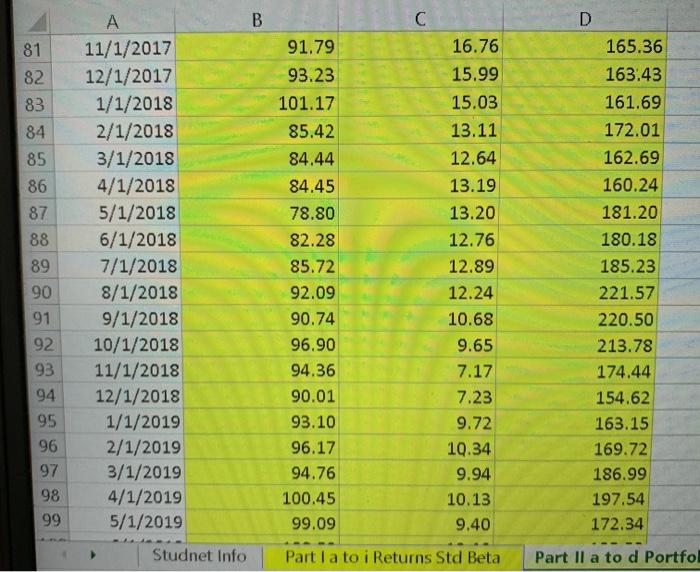
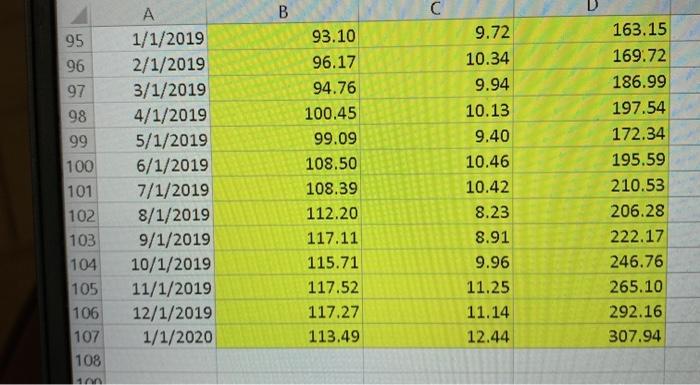

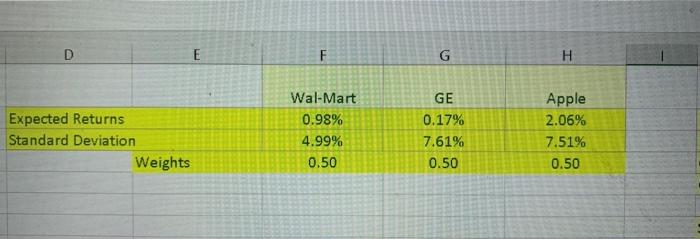
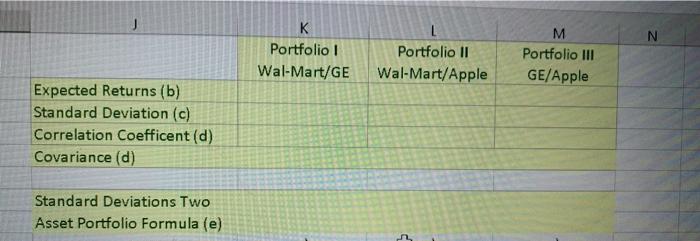
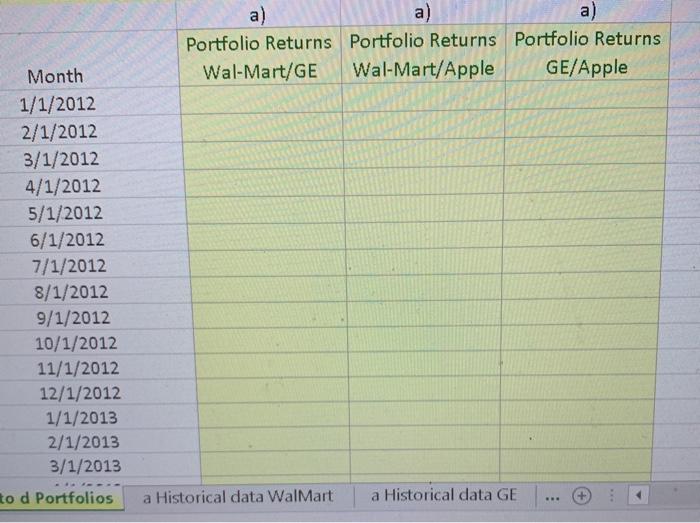
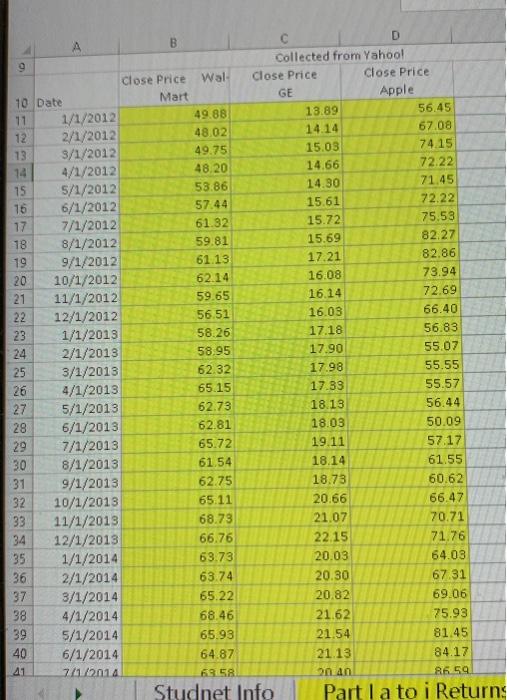
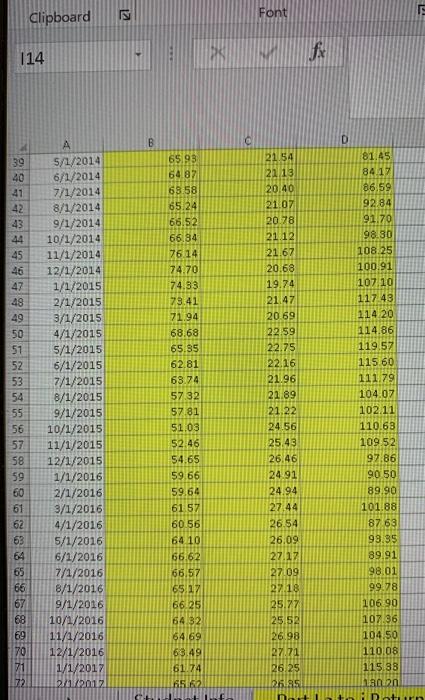
Part II: Use the data (returns) from project 01 and calculated for the following equal weighted portfolios: 1) Wal-Mart and GE ID) Wal-Mart and Apple III) GE and Apple a) Monthly returns b) Expected monthly returns (E[R]) of each equal weighted portfolio c) Standard deviation of each equal weighted portfolios using the (Std. S function) d) The correlation coefficient and the covariance between: 1) Wal-Mart and GE II) Wal-Mart and Apple IIT) GE and Apple e) Use the formula for a two-asset portfolio to calculate the standard deviation for an equal weighted portfolio between 1) Wal-Mart and GE II) Wal-Mart and Apple III) GE and Apple 9 B D Collected from Yahoo! Close Price Wal Close Price Close Price Mart GE Apple 10 Date 13.89 56.45 11 49.88 1/1/2012 12 48.02 67.08 2/1/2012 14.14 13 74.15 3/1/2012 49.75 15.03 14 72.22 4/1/2012 48.20 14.66 15 14.30 71.45 53.86 5/1/2012 16 6/1/2012 57.44 72.22 15.61 17 7/1/2012 61.32 15.72 75.53 18 8/1/2012 59.81 15.69 82.27 19 9/1/2012 61.13 17.21 82.86 20 10/1/2012 62.14 16.08 73.94 21 11/1/2012 59.65 16.14 72.69 22 12/1/2012 56.51 16.03 66.40 23 1/1/2013 58.26 17.18 56.83 24 2/1/2018 58.95 17.90 55.07 25 3/1/2018 62.32 55.55 17.98 26 4/1/2013 65.15 17.33 55.57 27 5/1/2013 62.73 18.13 56.44 28 6/1/2013 62.81 18.03 50.09 29 7/1/2013 65.72 19.11 57.17 30 8/1/2013 61.54 18.14 61.55 31 9/1/2013 62.75 18.73 60.62 32 10/1/2013 65.11 20.66 66.47 33 11/1/2013 68.73 21.07 70.71 34 12/1/2018 66.76 22.15 71.76 35 1/1/2014 63.73 20.03 64.03 36 2/1/2014 63.74 20.30 67.31 37 3/1/2014 65.22 20.82 69.06 38 4/1/2014 68.46 21.62 75.93 39 5/1/2014 65.93 21.54 81.45 40 6/1/2014 64.87 21.13 84.17 41 7/1/2014 6358 20 An 86.59 Studnet Info Part I a to i Returns IN Font Clipboard F 114 - fax B D 39 40 41 42 43 44 45 46 47 48 49 50 51 52 53 54 55 56 57 58 59 60 61 62 63 A 5/1/2014 6/1/2014 7/1/2014 8/1/2014 9/1/2014 10/1/2014 11/1/2014 12/1/2014 1/1/2015 2/1/2015 3/1/2015 4/1/2015 5/1/2015 6/1/2015 7/1/2015 8/1/2015 9/1/2015 10/1/2015 11/1/2015 12/1/2015 1/1/2016 2/1/2016 3/1/2016 4/1/2016 5/1/2016 6/1/2016 7/1/2016 8/1/2016 9/1/2016 10/1/2016 11/1/2016 12/1/2016 1/1/2017 03/11/2017 65.93 64.8 63.58 65.24 66.52 66.34 7614 74.70 74.33 73.41 71.94 68.68 65.85 62.81 68.74 57.32 57 81 51.03 52.46 54.65 59.66 59.64 61 57 60.56 6410 66.62 66.57 65.1% 66.25 64.32 64.69 63.49 61.74 6516 21.54 81.45 21 13 84.17 20.40 86.59 21.07 92.84 20.78 91.70 21.12 98.30 21.67 108.25 20.68 100.91 19.74 107.10 21.47 117.43 20 69 114 20 22.59 114.86 22.75 119.57 22.16 115 60 21.96 111.79 21.89 104.07 21.22 102 11 24.56 110.63 25.43 109.52 26.46 9786 24.91 9050 24.94 89.90 27.44 101.88 26.54 87.63 26.09 93.35 27.12 89.91 27.09 98.01 27.18 99.78 25.77 106 90 25.52 107.36 26.98 104.50 27.71 110.08 26 25 115.33 26.95 2n netun 65 66 67 69 69 70 71 72 C B 70 71 72 73 74 75 76 77 78 79 80 81 82 83 84 85 86 87 88 89 90 91 92 93 94 95 86 97 98 99 100 101 102 103 104 105 106 107 12/12016 112017 272017 312017 4/72017 5/T2017 6712017 7712017 872017 912017 10T2017 1712017 121T2017 T12018 272018 3712018 4772018 572018 672018 7172018 8172018 9172018 1012018 1712018 12112018 772019 2172019 372019 4/72019 5/72019 6/72019 7112019 8172019 9112019 10272019 1172019 12112019 TY2020 63.49 61.74 65.62 66.68 70.06 73.25 71.00 75.04 73.24 73.77 82.43 9179 93.23 101.17 85.42 84.44 84.45 78.80 82.28 85.72 92.09 90.74 96.90 94.36 90.01 93.10 96.17 94.76 100.45 99.09 108.50 108.39 112.20 117.11 115.71 117.52 117 27 113.49 27.71 26.25 26.35 26.56 25.83 24.40 24.07 23.22 22.26 2193 18.47 16.76 15.99 15.03 13.11 12.64 13.19 13.20 12.76 12.89 12.24 10.68 9.65 7.17 7.23 9.72 10.34 9.94 10.13 9.40 10.46 10.42 8.23 8.91 9.96 1125 11.14 12.44 D 110.08 115.33 130.20 137 13 137 12 145.82 138.04 14256 157.19 148.30 162.66 165.36 163.43 16169 172.01 162.69 160.24 18120 180.18 185.23 22157 220.50 213.78 174.44 154.62 163.15 169.72 186.99 197 54 172.34 195.59 210.53 206.28 22217 246.76 265.10 292.16 307.94 Studnet Info Partat a Alignment Number 1 Styles E F G H Wal-Mart Returns GE Returns Apple Returns NA 2 3 4 5 6 7; 8, 97 10 11 12 1/ 2/ 3/ 4/2 1 1 eturns Std Beta Part II a to d Portfolios a Historical data Walmart a Historical data GE D E F G H Expected Returns Standard Deviation Weights Wal-Mart 0.98% 4.99% 0.50 GE 0.17% 7.61% 0.50 Apple 2.06% 7.51% 0.50 N K L M a) a) a) Portfolio Returns Portfolio Returns Portfolio Returns Wal-Mart/GE Wal-Mart/Apple GE/Apple Month 1/1/2012 2/1/2012 3/1/2012 4/1/2012 5/1/2012 6/1/2012 7/1/2012 8/1/2012 9/1/2012 10/1/2012 11/1/2012 12/1/2012 1/1/2013 2/1/2013 3/1/2013 4/1/2013 a Historical data Walmart a Historical data GE WEB N K Portfolio Wal-Mart/GE Portfolio II Wal-Mart/Apple M Portfolio III GE/Apple Expected Returns (b) Standard Deviation (c) Correlation Coefficent (d) Covariance (d) Standard Deviations Two Asset Portfolio Formula (e) 15 A B Close Price Wal- 10 Date Mart 11 1/1/2012 49.88 12 2/1/2012 48.02 13 3/1/2012 49.75 14 4/1/2012 48.20 5/1/2012 53.86 16 6/1/2012 57.44 17 7/1/2012 61.32 8/1/2012 59.81 19 9/1/2012 61.13 20 10/1/2012 62.14 11/1/2012 59.65 22 12/1/2012 56.51 23 1/1/2013 58.26 24 2/1/2013 58.95 25 3/1/2013 62.32 26 4/1/2013 65.15 27 5/1/2013 62.73 C Close Price GE 13.89 14.14 15.03 14.66 14.30 15.61 15.72 15.69 17.21 16.08 16.14 16.03 17.18 17.90 17.98 17.33 18.13 D Close Price Apple 56.45 67.08 74.15 72.22 71.45 72.22 75.53 82.27 82.86 73.94 72.69 66.40 56.83 55.07 55.55 55.57 56.44 18 21 Studnet Info Part I a to i Returns Std Beta Part Il a to d Portfolios B C 27 62.73 28 29 30 31 32 33 34 35 36 37 38 39 40 41 42 43 44 45 A 5/1/2013 6/1/2013 7/1/2013 8/1/2013 9/1/2013 10/1/2013 11/1/2013 12/1/2013 1/1/2014 2/1/2014 3/1/2014 4/1/2014 5/1/2014 6/1/2014 7/1/2014 8/1/2014 9/1/2014 10/1/2014 11/1/2014 62.81 65.72 61.54 62.75 65.11 68.73 66.76 63.73 63.74 65.22 68.46 65.93 64.87 63.58 65.24 66.52 66.34 76.14 18.13 18.03 19.11 18.14 18.73 20.66 21.07 22.15 20.03 20.30 20.82 21.62 21.54 21.13 20.40 21.07 20.78 21.12 21.67 D 56.44 50.09 57.17 61.55 60.62 66.47 70.71 71.76 64.03 67.31 69.06 75.93 81.45 84.17 86.59 92.84 91.70 98.30 108.25 Studnet Info Part I a to i Returns Std Beta Part Il a to d Port B D 45 46 47 48 49 50 51 52 53 54 55 56 57 58 59 60 61 62 63 A 11/1/2014 12/1/2014 1/1/2015 2/1/2015 3/1/2015 4/1/2015 5/1/2015 6/1/2015 7/1/2015 8/1/2015 9/1/2015 10/1/2015 11/1/2015 12/1/2015 1/1/2016 2/1/2016 3/1/2016 4/1/2016 5/1/2016 76.14 74.70 74.33 73.41 71.94 68.68 65.35 62.81 63.74 57.32 57.81 51.03 52.46 54.65 59.66 59.64 61.57 60.56 64.10 21.67 20.68 19.74 21.47 20.69 22.59 22.75 22.16 21.96 21.89 21.22 24.56 25.43 26.46 24.91 24.94 27.44 26.54 26.09 108.25 100.91 107.10 117.43 114.20 114.86 119.57 115.60 111.79 104.07 102.11 110.63 109.52 97.86 90.50 89.90 101.88 87.63 93.35 Studnet Info Part I a to i Returns Std Beta Part Il a to d Portfoli B C D 93.35 89.91 63 64 65 66 67 68 69 A 5/1/2016 6/1/2016 7/1/2016 8/1/2016 9/1/2016 10/1/2016 11/1/2016 12/1/2016 1/1/2017 2/1/2017 3/1/2017 4/1/2017 5/1/2017 6/1/2017 7/1/2017 8/1/2017 9/1/2017 10/1/2017 11/1/2017 64.10 66.62 66.57 65.17 66.25 64.32 64.69 63.49 61.74 65.62 66.68 70 71 72 73 74 75 76 77 78 79 80 81 26.09 27.17 27.09 27.18 25.77 25.52 26.98 27.71 26.25 26.35 26.56 25.83 24.40 24.07 23.22 22.26 21.93 18.47 16.76 98.01 99.78 106.90 107.36 104.50 110.08 115.33 130.20 137.13 137.12 145.82 138.04 142.56 157.19 148.30 162.66 165.36 70.06 73.25 71.00 75.04 73.24 73.77 82.43 91.79 Studnet Info Part I a to i Returns Std Beta Part Il a to d Portf B C 81 82 83 84 85 86 87 88 89 90 91 92 93 94 95 96 97 98 99 A 11/1/2017 12/1/2017 1/1/2018 2/1/2018 3/1/2018 4/1/2018 5/1/2018 6/1/2018 7/1/2018 8/1/2018 9/1/2018 10/1/2018 11/1/2018 12/1/2018 1/1/2019 2/1/2019 3/1/2019 4/1/2019 5/1/2019 91.79 93.23 101.17 85.42 84.44 84.45 78.80 82.28 85.72 92.09 90.74 96.90 94.36 90.01 93.10 96.17 94.76 100.45 99.09 16.76 15.99 15.03 13.11 12.64 13.19 13.20 12.76 12.89 12.24 10.68 9.65 7.17 D 165.36 163.43 161.69 172.01 162.69 160.24 181.20 180.18 185.23 221.57 220.50 213.78 174.44 154.62 163.15 169.72 186.99 197.54 172.34 7.23 9.72 10.34 9.94 10.13 9.40 Studnet Info Part I a to i Returns Std Beta Part II a to d Portfol B C 95 96 97 98 99 100 101 102 103 104 105 106 107 108 A 1/1/2019 2/1/2019 3/1/2019 4/1/2019 5/1/2019 6/1/2019 7/1/2019 8/1/2019 9/1/2019 10/1/2019 11/1/2019 12/1/2019 1/1/2020 93.10 96.17 94.76 100.45 99.09 108.50 108.39 112.20 117.11 115.71 117.52 117.27 113.49 9.72 10.34 9.94 10.13 9.40 10.46 10.42 8.23 8.91 9.96 11.25 11.14 12.44 163.15 169.72 186.99 197.54 172.34 195.59 210.53 206.28 222.17 246.76 265.10 292.16 307.94 10 Format % 98 V Formatting Table Styles Styles Cells lumber 5 F G H Wal-Mart Returns GE Returns Apple Returns ios a Historical data Walmart a Historical data GE + : 99+ D E F G H Expected Returns Standard Deviation Weights Wal-Mart 0.98% 4.99% 0.50 GE 0.17% 7.61% 0.50 Apple 2.06% 7.51% 0.50 J N K Portfolio 1 Wal-Mart/GE Portfolio II Wal-Mart/Apple M Portfolio III GE/Apple Expected Returns (b) Standard Deviation (c) Correlation Coefficent (d) Covariance (d) Standard Deviations Two Asset Portfolio Formula (e) a) a) a) Portfolio Returns Portfolio Returns Portfolio Returns Wal-Mart/GE Wal-Mart/Apple GE/Apple Month 1/1/2012 2/1/2012 3/1/2012 4/1/2012 5/1/2012 6/1/2012 7/1/2012 8/1/2012 9/1/2012 10/1/2012 11/1/2012 12/1/2012 1/1/2013 2/1/2013 3/1/2013 -- to d Portfolios a Historical data Walmart a Historical data GE Part II: Use the data (returns) from project 01 and calculated for the following equal weighted portfolios: 1) Wal-Mart and GE ID) Wal-Mart and Apple III) GE and Apple a) Monthly returns b) Expected monthly returns (E[R]) of each equal weighted portfolio c) Standard deviation of each equal weighted portfolios using the (Std. S function) d) The correlation coefficient and the covariance between: 1) Wal-Mart and GE II) Wal-Mart and Apple IIT) GE and Apple e) Use the formula for a two-asset portfolio to calculate the standard deviation for an equal weighted portfolio between 1) Wal-Mart and GE II) Wal-Mart and Apple III) GE and Apple 9 B D Collected from Yahoo! Close Price Wal Close Price Close Price Mart GE Apple 10 Date 13.89 56.45 11 49.88 1/1/2012 12 48.02 67.08 2/1/2012 14.14 13 74.15 3/1/2012 49.75 15.03 14 72.22 4/1/2012 48.20 14.66 15 14.30 71.45 53.86 5/1/2012 16 6/1/2012 57.44 72.22 15.61 17 7/1/2012 61.32 15.72 75.53 18 8/1/2012 59.81 15.69 82.27 19 9/1/2012 61.13 17.21 82.86 20 10/1/2012 62.14 16.08 73.94 21 11/1/2012 59.65 16.14 72.69 22 12/1/2012 56.51 16.03 66.40 23 1/1/2013 58.26 17.18 56.83 24 2/1/2018 58.95 17.90 55.07 25 3/1/2018 62.32 55.55 17.98 26 4/1/2013 65.15 17.33 55.57 27 5/1/2013 62.73 18.13 56.44 28 6/1/2013 62.81 18.03 50.09 29 7/1/2013 65.72 19.11 57.17 30 8/1/2013 61.54 18.14 61.55 31 9/1/2013 62.75 18.73 60.62 32 10/1/2013 65.11 20.66 66.47 33 11/1/2013 68.73 21.07 70.71 34 12/1/2018 66.76 22.15 71.76 35 1/1/2014 63.73 20.03 64.03 36 2/1/2014 63.74 20.30 67.31 37 3/1/2014 65.22 20.82 69.06 38 4/1/2014 68.46 21.62 75.93 39 5/1/2014 65.93 21.54 81.45 40 6/1/2014 64.87 21.13 84.17 41 7/1/2014 6358 20 An 86.59 Studnet Info Part I a to i Returns IN Font Clipboard F 114 - fax B D 39 40 41 42 43 44 45 46 47 48 49 50 51 52 53 54 55 56 57 58 59 60 61 62 63 A 5/1/2014 6/1/2014 7/1/2014 8/1/2014 9/1/2014 10/1/2014 11/1/2014 12/1/2014 1/1/2015 2/1/2015 3/1/2015 4/1/2015 5/1/2015 6/1/2015 7/1/2015 8/1/2015 9/1/2015 10/1/2015 11/1/2015 12/1/2015 1/1/2016 2/1/2016 3/1/2016 4/1/2016 5/1/2016 6/1/2016 7/1/2016 8/1/2016 9/1/2016 10/1/2016 11/1/2016 12/1/2016 1/1/2017 03/11/2017 65.93 64.8 63.58 65.24 66.52 66.34 7614 74.70 74.33 73.41 71.94 68.68 65.85 62.81 68.74 57.32 57 81 51.03 52.46 54.65 59.66 59.64 61 57 60.56 6410 66.62 66.57 65.1% 66.25 64.32 64.69 63.49 61.74 6516 21.54 81.45 21 13 84.17 20.40 86.59 21.07 92.84 20.78 91.70 21.12 98.30 21.67 108.25 20.68 100.91 19.74 107.10 21.47 117.43 20 69 114 20 22.59 114.86 22.75 119.57 22.16 115 60 21.96 111.79 21.89 104.07 21.22 102 11 24.56 110.63 25.43 109.52 26.46 9786 24.91 9050 24.94 89.90 27.44 101.88 26.54 87.63 26.09 93.35 27.12 89.91 27.09 98.01 27.18 99.78 25.77 106 90 25.52 107.36 26.98 104.50 27.71 110.08 26 25 115.33 26.95 2n netun 65 66 67 69 69 70 71 72 C B 70 71 72 73 74 75 76 77 78 79 80 81 82 83 84 85 86 87 88 89 90 91 92 93 94 95 86 97 98 99 100 101 102 103 104 105 106 107 12/12016 112017 272017 312017 4/72017 5/T2017 6712017 7712017 872017 912017 10T2017 1712017 121T2017 T12018 272018 3712018 4772018 572018 672018 7172018 8172018 9172018 1012018 1712018 12112018 772019 2172019 372019 4/72019 5/72019 6/72019 7112019 8172019 9112019 10272019 1172019 12112019 TY2020 63.49 61.74 65.62 66.68 70.06 73.25 71.00 75.04 73.24 73.77 82.43 9179 93.23 101.17 85.42 84.44 84.45 78.80 82.28 85.72 92.09 90.74 96.90 94.36 90.01 93.10 96.17 94.76 100.45 99.09 108.50 108.39 112.20 117.11 115.71 117.52 117 27 113.49 27.71 26.25 26.35 26.56 25.83 24.40 24.07 23.22 22.26 2193 18.47 16.76 15.99 15.03 13.11 12.64 13.19 13.20 12.76 12.89 12.24 10.68 9.65 7.17 7.23 9.72 10.34 9.94 10.13 9.40 10.46 10.42 8.23 8.91 9.96 1125 11.14 12.44 D 110.08 115.33 130.20 137 13 137 12 145.82 138.04 14256 157.19 148.30 162.66 165.36 163.43 16169 172.01 162.69 160.24 18120 180.18 185.23 22157 220.50 213.78 174.44 154.62 163.15 169.72 186.99 197 54 172.34 195.59 210.53 206.28 22217 246.76 265.10 292.16 307.94 Studnet Info Partat a Alignment Number 1 Styles E F G H Wal-Mart Returns GE Returns Apple Returns NA 2 3 4 5 6 7; 8, 97 10 11 12 1/ 2/ 3/ 4/2 1 1 eturns Std Beta Part II a to d Portfolios a Historical data Walmart a Historical data GE D E F G H Expected Returns Standard Deviation Weights Wal-Mart 0.98% 4.99% 0.50 GE 0.17% 7.61% 0.50 Apple 2.06% 7.51% 0.50 N K L M a) a) a) Portfolio Returns Portfolio Returns Portfolio Returns Wal-Mart/GE Wal-Mart/Apple GE/Apple Month 1/1/2012 2/1/2012 3/1/2012 4/1/2012 5/1/2012 6/1/2012 7/1/2012 8/1/2012 9/1/2012 10/1/2012 11/1/2012 12/1/2012 1/1/2013 2/1/2013 3/1/2013 4/1/2013 a Historical data Walmart a Historical data GE WEB N K Portfolio Wal-Mart/GE Portfolio II Wal-Mart/Apple M Portfolio III GE/Apple Expected Returns (b) Standard Deviation (c) Correlation Coefficent (d) Covariance (d) Standard Deviations Two Asset Portfolio Formula (e) 15 A B Close Price Wal- 10 Date Mart 11 1/1/2012 49.88 12 2/1/2012 48.02 13 3/1/2012 49.75 14 4/1/2012 48.20 5/1/2012 53.86 16 6/1/2012 57.44 17 7/1/2012 61.32 8/1/2012 59.81 19 9/1/2012 61.13 20 10/1/2012 62.14 11/1/2012 59.65 22 12/1/2012 56.51 23 1/1/2013 58.26 24 2/1/2013 58.95 25 3/1/2013 62.32 26 4/1/2013 65.15 27 5/1/2013 62.73 C Close Price GE 13.89 14.14 15.03 14.66 14.30 15.61 15.72 15.69 17.21 16.08 16.14 16.03 17.18 17.90 17.98 17.33 18.13 D Close Price Apple 56.45 67.08 74.15 72.22 71.45 72.22 75.53 82.27 82.86 73.94 72.69 66.40 56.83 55.07 55.55 55.57 56.44 18 21 Studnet Info Part I a to i Returns Std Beta Part Il a to d Portfolios B C 27 62.73 28 29 30 31 32 33 34 35 36 37 38 39 40 41 42 43 44 45 A 5/1/2013 6/1/2013 7/1/2013 8/1/2013 9/1/2013 10/1/2013 11/1/2013 12/1/2013 1/1/2014 2/1/2014 3/1/2014 4/1/2014 5/1/2014 6/1/2014 7/1/2014 8/1/2014 9/1/2014 10/1/2014 11/1/2014 62.81 65.72 61.54 62.75 65.11 68.73 66.76 63.73 63.74 65.22 68.46 65.93 64.87 63.58 65.24 66.52 66.34 76.14 18.13 18.03 19.11 18.14 18.73 20.66 21.07 22.15 20.03 20.30 20.82 21.62 21.54 21.13 20.40 21.07 20.78 21.12 21.67 D 56.44 50.09 57.17 61.55 60.62 66.47 70.71 71.76 64.03 67.31 69.06 75.93 81.45 84.17 86.59 92.84 91.70 98.30 108.25 Studnet Info Part I a to i Returns Std Beta Part Il a to d Port B D 45 46 47 48 49 50 51 52 53 54 55 56 57 58 59 60 61 62 63 A 11/1/2014 12/1/2014 1/1/2015 2/1/2015 3/1/2015 4/1/2015 5/1/2015 6/1/2015 7/1/2015 8/1/2015 9/1/2015 10/1/2015 11/1/2015 12/1/2015 1/1/2016 2/1/2016 3/1/2016 4/1/2016 5/1/2016 76.14 74.70 74.33 73.41 71.94 68.68 65.35 62.81 63.74 57.32 57.81 51.03 52.46 54.65 59.66 59.64 61.57 60.56 64.10 21.67 20.68 19.74 21.47 20.69 22.59 22.75 22.16 21.96 21.89 21.22 24.56 25.43 26.46 24.91 24.94 27.44 26.54 26.09 108.25 100.91 107.10 117.43 114.20 114.86 119.57 115.60 111.79 104.07 102.11 110.63 109.52 97.86 90.50 89.90 101.88 87.63 93.35 Studnet Info Part I a to i Returns Std Beta Part Il a to d Portfoli B C D 93.35 89.91 63 64 65 66 67 68 69 A 5/1/2016 6/1/2016 7/1/2016 8/1/2016 9/1/2016 10/1/2016 11/1/2016 12/1/2016 1/1/2017 2/1/2017 3/1/2017 4/1/2017 5/1/2017 6/1/2017 7/1/2017 8/1/2017 9/1/2017 10/1/2017 11/1/2017 64.10 66.62 66.57 65.17 66.25 64.32 64.69 63.49 61.74 65.62 66.68 70 71 72 73 74 75 76 77 78 79 80 81 26.09 27.17 27.09 27.18 25.77 25.52 26.98 27.71 26.25 26.35 26.56 25.83 24.40 24.07 23.22 22.26 21.93 18.47 16.76 98.01 99.78 106.90 107.36 104.50 110.08 115.33 130.20 137.13 137.12 145.82 138.04 142.56 157.19 148.30 162.66 165.36 70.06 73.25 71.00 75.04 73.24 73.77 82.43 91.79 Studnet Info Part I a to i Returns Std Beta Part Il a to d Portf B C 81 82 83 84 85 86 87 88 89 90 91 92 93 94 95 96 97 98 99 A 11/1/2017 12/1/2017 1/1/2018 2/1/2018 3/1/2018 4/1/2018 5/1/2018 6/1/2018 7/1/2018 8/1/2018 9/1/2018 10/1/2018 11/1/2018 12/1/2018 1/1/2019 2/1/2019 3/1/2019 4/1/2019 5/1/2019 91.79 93.23 101.17 85.42 84.44 84.45 78.80 82.28 85.72 92.09 90.74 96.90 94.36 90.01 93.10 96.17 94.76 100.45 99.09 16.76 15.99 15.03 13.11 12.64 13.19 13.20 12.76 12.89 12.24 10.68 9.65 7.17 D 165.36 163.43 161.69 172.01 162.69 160.24 181.20 180.18 185.23 221.57 220.50 213.78 174.44 154.62 163.15 169.72 186.99 197.54 172.34 7.23 9.72 10.34 9.94 10.13 9.40 Studnet Info Part I a to i Returns Std Beta Part II a to d Portfol B C 95 96 97 98 99 100 101 102 103 104 105 106 107 108 A 1/1/2019 2/1/2019 3/1/2019 4/1/2019 5/1/2019 6/1/2019 7/1/2019 8/1/2019 9/1/2019 10/1/2019 11/1/2019 12/1/2019 1/1/2020 93.10 96.17 94.76 100.45 99.09 108.50 108.39 112.20 117.11 115.71 117.52 117.27 113.49 9.72 10.34 9.94 10.13 9.40 10.46 10.42 8.23 8.91 9.96 11.25 11.14 12.44 163.15 169.72 186.99 197.54 172.34 195.59 210.53 206.28 222.17 246.76 265.10 292.16 307.94 10 Format % 98 V Formatting Table Styles Styles Cells lumber 5 F G H Wal-Mart Returns GE Returns Apple Returns ios a Historical data Walmart a Historical data GE + : 99+ D E F G H Expected Returns Standard Deviation Weights Wal-Mart 0.98% 4.99% 0.50 GE 0.17% 7.61% 0.50 Apple 2.06% 7.51% 0.50 J N K Portfolio 1 Wal-Mart/GE Portfolio II Wal-Mart/Apple M Portfolio III GE/Apple Expected Returns (b) Standard Deviation (c) Correlation Coefficent (d) Covariance (d) Standard Deviations Two Asset Portfolio Formula (e) a) a) a) Portfolio Returns Portfolio Returns Portfolio Returns Wal-Mart/GE Wal-Mart/Apple GE/Apple Month 1/1/2012 2/1/2012 3/1/2012 4/1/2012 5/1/2012 6/1/2012 7/1/2012 8/1/2012 9/1/2012 10/1/2012 11/1/2012 12/1/2012 1/1/2013 2/1/2013 3/1/2013 -- to d Portfolios a Historical data Walmart a Historical data GE
Step by Step Solution
There are 3 Steps involved in it

Get step-by-step solutions from verified subject matter experts