

Question: 1. A common final is given in MATH 1040 at Utah Valley University. The math department chair collects the data for all sections, and
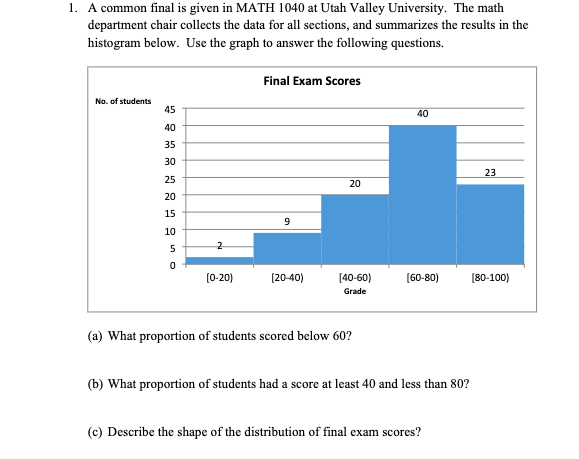
1. A common final is given in MATH 1040 at Utah Valley University. The math department chair collects the data for all sections, and summarizes the results in the histogram below. Use the graph to answer the following questions. Final Exam Scores No. of students 45 40 40 35 30 23 25 20 20 15 9 10 2 5 0 (0-20) (20-40) [40-60) Grade (60-80) [80-100) (a) What proportion of students scored below 60? (b) What proportion of students had a score at least 40 and less than 80? (c) Describe the shape of the distribution of final exam scores?
Step by Step Solution
There are 3 Steps involved in it
1 Expert Approved Answer
Step: 1 Unlock

Question Has Been Solved by an Expert!
Get step-by-step solutions from verified subject matter experts
Step: 2 Unlock
Step: 3 Unlock