

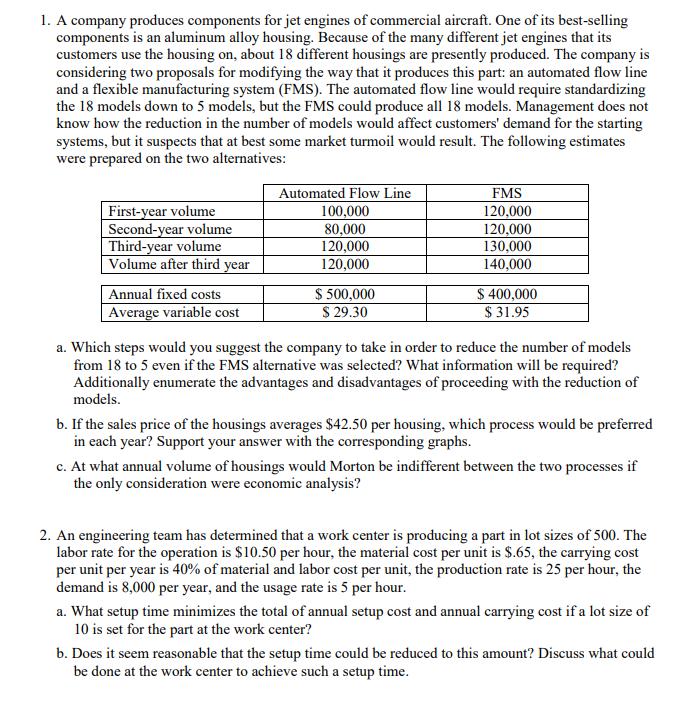
1. A company produces components for jet engines of commercial aircraft. One of its best-selling components...
Fantastic news! We've Found the answer you've been seeking!
Question:
Transcribed Image Text:
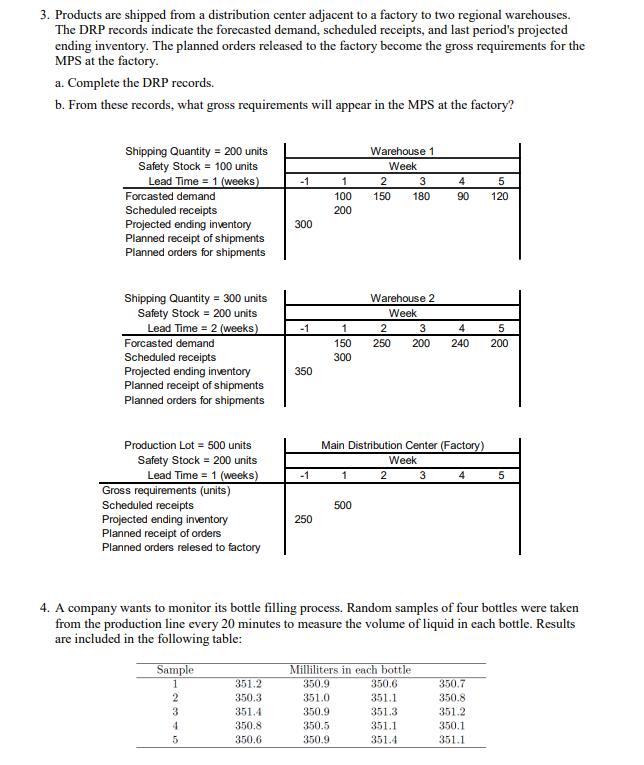
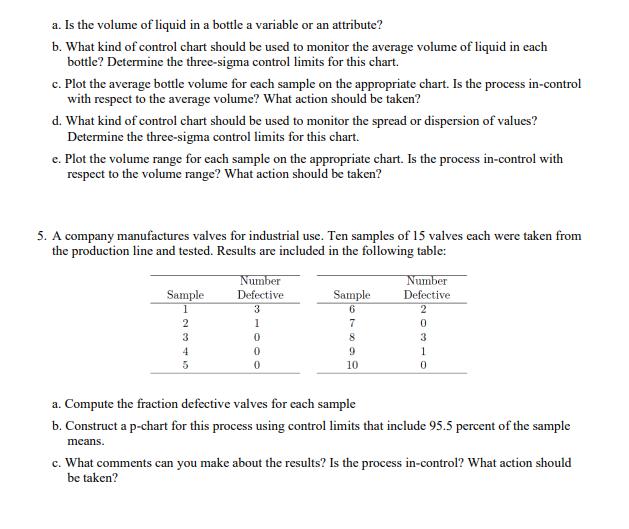
1. A company produces components for jet engines of commercial aircraft. One of its best-selling components is an aluminum alloy housing. Because of the many different jet engines that its customers use the housing on, about 18 different housings are presently produced. The company is considering two proposals for modifying the way that it produces this part: an automated flow line and a flexible manufacturing system (FMS). The automated flow line would require standardizing the 18 models down to 5 models, but the FMS could produce all 18 models. Management does not know how the reduction in the number of models would affect customers' demand for the starting systems, but it suspects that at best some market turmoil would result. The following estimates were prepared on the two alternatives: First-year volume Second-year volume Third-year volume Volume after third year Annual fixed costs Average variable cost Automated Flow Line 100,000 80,000 120,000 120,000 $ 500,000 $ 29.30 FMS 120,000 120,000 130,000 140,000 $ 400,000 $31.95 a. Which steps would you suggest the company to take in order to reduce the number of models from 18 to 5 even if the FMS alternative was selected? What information will be required? Additionally enumerate the advantages and disadvantages of proceeding with the reduction of models. b. If the sales price of the housings averages $42.50 per housing, which process would be preferred in each year? Support your answer with the corresponding graphs. c. At what annual volume of housings would Morton be indifferent between the two processes if the only consideration were economic analysis? 2. An engineering team has determined that a work center is producing a part in lot sizes of 500. The labor rate for the operation is $10.50 per hour, the material cost per unit is $.65, the carrying cost per unit per year is 40% of material and labor cost per unit, the production rate is 25 per hour, the demand is 8,000 per year, and the usage rate is 5 per hour. a. What setup time minimizes the total of annual setup cost and annual carrying cost if a lot size of 10 is set for the part at the work center? b. Does it seem reasonable that the setup time could be reduced to this amount? Discuss what could be done at the work center to achieve such a setup time. 3. Products are shipped from a distribution center adjacent to a factory to two regional warehouses. The DRP records indicate the forecasted demand, scheduled receipts, and last period's projected ending inventory. The planned orders released to the factory become the gross requirements for the MPS at the factory. a. Complete the DRP records. b. From these records, what gross requirements will appear in the MPS at the factory? Shipping Quantity = 200 units Safety Stock = 100 units Lead Time 1 (weeks) Forcasted demand Scheduled receipts Projected ending inventory Planned receipt of shipments Planned orders for shipments Shipping Quantity = 300 units Safety Stock = 200 units Lead Time = 2 (weeks) Forcasted demand Scheduled receipts Projected ending inventory Planned receipt of shipments Planned orders for shipments Production Lot = 500 units Safety Stock = 200 units Lead Time = 1 (weeks) Gross requirements (units) Scheduled receipts Projected ending inventory Planned receipt of orders Planned orders relesed to factory Sample 1 2 3 4 5 351.2 350.3 -1 351.4 350.8 350.6 300 -1 350 -1 250 1 100 200 351.0 350.9 350.5 350.9 Warehouse 1 Week 1 2 3 150 180 500 Warehouse 2 Week 1 2 3 4 5 150 250 200 240 200 300 Main Distribution Center (Factory) Week 2 4. A company wants to monitor its bottle filling process. Random samples of four bottles were taken from the production line every 20 minutes to measure the volume of liquid in each bottle. Results are included in the following table: Milliliters in each bottle 350.9 4 5 90 120 3 350.6 351.1 351.3 351.1 351.4 4 5 350.7 350.8 351.2 350.1 351.1 a. Is the volume of liquid in a bottle a variable or an attribute? b. What kind of control chart should be used to monitor the average volume of liquid in each bottle? Determine the three-sigma control limits for this chart. c. Plot the average bottle volume for each sample on the appropriate chart. Is the process in-control with respect to the average volume? What action should be taken? d. What kind of control chart should be used to monitor the spread or dispersion of values? Determine the three-sigma control limits for this chart. e. Plot the volume range for each sample on the appropriate chart. Is the process in-control with respect to the volume range? What action should be taken? 5. A company manufactures valves for industrial use. Ten samples of 15 valves each were taken from the production line and tested. Results are included in the following table: Sample 1 2 3 4 5 Number Defective 3 1 0 0 0 Sample 6 7 8 9 10 Number Defective 2 0 3 1 0 a. Compute the fraction defective valves for each sample b. Construct a p-chart for this process using control limits that include 95.5 percent of the sample means. c. What comments can you make about the results? Is the process in-control? What action should be taken? 1. A company produces components for jet engines of commercial aircraft. One of its best-selling components is an aluminum alloy housing. Because of the many different jet engines that its customers use the housing on, about 18 different housings are presently produced. The company is considering two proposals for modifying the way that it produces this part: an automated flow line and a flexible manufacturing system (FMS). The automated flow line would require standardizing the 18 models down to 5 models, but the FMS could produce all 18 models. Management does not know how the reduction in the number of models would affect customers' demand for the starting systems, but it suspects that at best some market turmoil would result. The following estimates were prepared on the two alternatives: First-year volume Second-year volume Third-year volume Volume after third year Annual fixed costs Average variable cost Automated Flow Line 100,000 80,000 120,000 120,000 $ 500,000 $ 29.30 FMS 120,000 120,000 130,000 140,000 $ 400,000 $31.95 a. Which steps would you suggest the company to take in order to reduce the number of models from 18 to 5 even if the FMS alternative was selected? What information will be required? Additionally enumerate the advantages and disadvantages of proceeding with the reduction of models. b. If the sales price of the housings averages $42.50 per housing, which process would be preferred in each year? Support your answer with the corresponding graphs. c. At what annual volume of housings would Morton be indifferent between the two processes if the only consideration were economic analysis? 2. An engineering team has determined that a work center is producing a part in lot sizes of 500. The labor rate for the operation is $10.50 per hour, the material cost per unit is $.65, the carrying cost per unit per year is 40% of material and labor cost per unit, the production rate is 25 per hour, the demand is 8,000 per year, and the usage rate is 5 per hour. a. What setup time minimizes the total of annual setup cost and annual carrying cost if a lot size of 10 is set for the part at the work center? b. Does it seem reasonable that the setup time could be reduced to this amount? Discuss what could be done at the work center to achieve such a setup time. 3. Products are shipped from a distribution center adjacent to a factory to two regional warehouses. The DRP records indicate the forecasted demand, scheduled receipts, and last period's projected ending inventory. The planned orders released to the factory become the gross requirements for the MPS at the factory. a. Complete the DRP records. b. From these records, what gross requirements will appear in the MPS at the factory? Shipping Quantity = 200 units Safety Stock = 100 units Lead Time 1 (weeks) Forcasted demand Scheduled receipts Projected ending inventory Planned receipt of shipments Planned orders for shipments Shipping Quantity = 300 units Safety Stock = 200 units Lead Time = 2 (weeks) Forcasted demand Scheduled receipts Projected ending inventory Planned receipt of shipments Planned orders for shipments Production Lot = 500 units Safety Stock = 200 units Lead Time = 1 (weeks) Gross requirements (units) Scheduled receipts Projected ending inventory Planned receipt of orders Planned orders relesed to factory Sample 1 2 3 4 5 351.2 350.3 -1 351.4 350.8 350.6 300 -1 350 -1 250 1 100 200 351.0 350.9 350.5 350.9 Warehouse 1 Week 1 2 3 150 180 500 Warehouse 2 Week 1 2 3 4 5 150 250 200 240 200 300 Main Distribution Center (Factory) Week 2 4. A company wants to monitor its bottle filling process. Random samples of four bottles were taken from the production line every 20 minutes to measure the volume of liquid in each bottle. Results are included in the following table: Milliliters in each bottle 350.9 4 5 90 120 3 350.6 351.1 351.3 351.1 351.4 4 5 350.7 350.8 351.2 350.1 351.1 a. Is the volume of liquid in a bottle a variable or an attribute? b. What kind of control chart should be used to monitor the average volume of liquid in each bottle? Determine the three-sigma control limits for this chart. c. Plot the average bottle volume for each sample on the appropriate chart. Is the process in-control with respect to the average volume? What action should be taken? d. What kind of control chart should be used to monitor the spread or dispersion of values? Determine the three-sigma control limits for this chart. e. Plot the volume range for each sample on the appropriate chart. Is the process in-control with respect to the volume range? What action should be taken? 5. A company manufactures valves for industrial use. Ten samples of 15 valves each were taken from the production line and tested. Results are included in the following table: Sample 1 2 3 4 5 Number Defective 3 1 0 0 0 Sample 6 7 8 9 10 Number Defective 2 0 3 1 0 a. Compute the fraction defective valves for each sample b. Construct a p-chart for this process using control limits that include 95.5 percent of the sample means. c. What comments can you make about the results? Is the process in-control? What action should be taken?
Expert Answer:
Answer rating: 100% (QA)
a To reduce the number of models from 18 to 5 the company would need to take the following steps 1 Analyze the demand patterns The company should analyze the historical demand for each of the 18 model... View the full answer

Related Book For 

Database Systems Design Implementation and Management
ISBN: 978-1337627900
13th edition
Authors: Carlos Coronel, Steven Morris
Posted Date:
Students also viewed these accounting questions
-
A company produces components for jet engines of commercial aircraft. One of its best-selling components is aluminum alloy housing. Because of the many different jet engines that its customers use...
-
Managing Scope Changes Case Study Scope changes on a project can occur regardless of how well the project is planned or executed. Scope changes can be the result of something that was omitted during...
-
Planning is one of the most important management functions in any business. A front office managers first step in planning should involve determine the departments goals. Planning also includes...
-
Expected manufacturing costs for Imperial Data Devices are as follows: Variable Costs Fixed Costs per Month Direct material $8.00/unit Supervisory salaries $17,000 Direct labor 3.50/unit Factory...
-
Explain why an appropriation of Retained Earnings is not the same as setting aside cash. How does a corporation dispose of a Retained Earnings Appropriated account such as Retained Earnings...
-
What is the demographic-transition theory? Do you think that this model applies to all cultures in the world?
-
The salaries (in thousand dollars) of a sample of 10 employees Find the mean, the median, and the mode of the data, if possible. If any measure cannot be found or does not represent the center of the...
-
Uranium Mining Company, founded in 1982 to mine and market uranium, purchased a mine in 1983 for $900 million. It estimated that the uranium had a market value of $150 per ounce. By 2010, the market...
-
How much work ( in joules) is done in lifting a 45.57 newton box from the floor to a table that is 0.73 meters above the floor? Round your final answer to two decimal places. A ball is thrown...
-
Hugo Boss AG is a German designer, manufacturer, and distributer of mens and womens clothing, operating in the higher end of the clothing retail industry. During the period 20042017, the company...
-
Need help to solve the problem by hand? Click this video! Fill out the table below: # Y ty 1 15 2 14 14 4 7 13 5 8 13 SUM The correlation coefficient is (round to three decimal places): 7 = Find the...
-
What should we do if there is more than one primary actor for the use case?
-
MARRIOTT: Marketing Research Leads to Expanded Offerings Visit www.pearsonglobaleditions.com/malhotra to read the video case and view the accompanying video. Marriott: Marketing Research Leads to...
-
Calculate the straight-line and sum-of-years-digits depreciation schedules for a \($450\) video camera that will have a salvage value of \($50\) after five years of use.
-
Provide an example for use case generalization. What is its significance?
-
Give three specialized subclasses for the Student class.
-
Discuss the barriers and sources of active and passive innovation resistance in the context of Apple Watch.
-
Show, if u(x, y) and v(x, y) are harmonic functions, that u + v must be a harmonic function but that uv need not be a harmonic function. Is e"e" a harmonic function?
-
Given the employee information in Question 19, what is the query output for the UNION ALL query? (List the query output.) Data from Question 19 Suppose that you have two tables, EMPLOYEE and...
-
What major factors should be addressed when database system performance is evaluated? Discuss each factor briefly.
-
Describe and explain the client/server architectural principles.
-
A faculty member wishes to assess the relationship between students' scores on the Scholastic Aptitude test (SAT) and their performance in college. a. What is a possible research hypothesis in this...
-
Name the scale of measurement (nominal, ordinal, interval, ratio) for each of the following variables: a. One's age (in years) b. Size of soft drink (small, medium, large, extra large) c. Voting...
-
Name the scale of measurement (nominal, ordinal, interval, ratio) for each of the following variables: a. The amount of time needed to react to a sound b. Gender c. Score on the Scholastic Aptitude...

Study smarter with the SolutionInn App