

Question: 1. A decrease in supply is depicted by a A. movement from point x topoint y . B. shift from S 2 to S 1
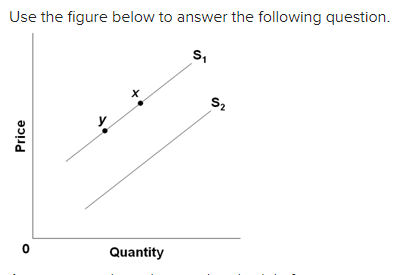
1. A decrease in supply is depicted by a
A. movement from point x topoint y.
B. shift from S2 to S1.
C. shift from S1 to S2.
D. movement from point y topoint x.
2. Using the same graph above, an increase in quantity suppliedis depicted by a
A. shift from S2 to S1.
B. shift from S1 to S2.
C. move from point y topoint x.
D. move from point x topoint y.
3. Using the same graph above, a movement along the supplyschedule from point x topoint y depicts
A. a decrease in supply.
B. an increase in supply.
C. an increase in quantity supplied.
D. a decrease in quantity supplied.
Step by Step Solution
3.40 Rating (150 Votes )
There are 3 Steps involved in it
1Option B is correct A decrease in the supply is depicted by a shift from S2 to S1 When the ... View full answer

Get step-by-step solutions from verified subject matter experts