

Question: 1 A huge botel chain has been collecting data on demand for hotel rooms for only the past 2 years. Data are shown in the
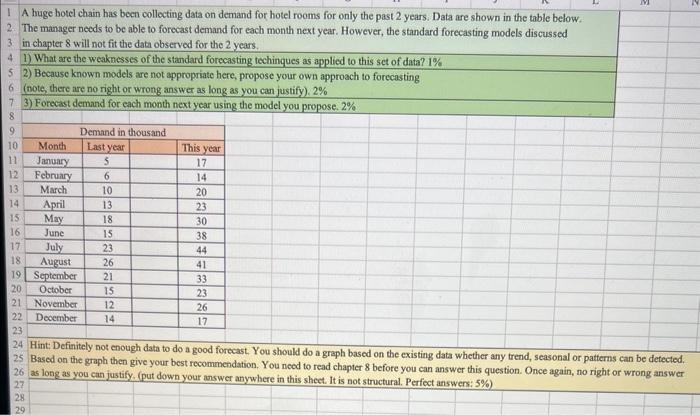
1 A huge botel chain has been collecting data on demand for hotel rooms for only the past 2 years. Data are shown in the table below. 2. The manager needs to be able to forecast demand for each month next year. However, the standard forecasting models discussed 3 in chapter 8 will not fit the data observed for the 2 years. 1) What are the weaknesses of the standard forecasting techinques as applied to this set of data? 1% 2) Because known models are not appropriate here, propose your own approach to forecasting (note, there are no right or wrong answer as long as you can justify), 2% 3) Forecast demand for each month next year using the model you propose. 2% \begin{tabular}{|c|c|c|c|c|} \hline 8 & \multicolumn{3}{|c|}{} & \multicolumn{2}{|c|}{} \\ \hline 9 & \multicolumn{3}{|c|}{ Demand in thousand } \\ \hline 10 & Month & Last year & & This year \\ \hline 11 & January & 5 & & 17 \\ \hline 12 & February & 6 & & 14 \\ \hline 13 & March & 10 & & 20 \\ \hline 14 & April & 13 & & 23 \\ \hline 15 & May & 18 & & 30 \\ \hline 16 & June & 15 & & 38 \\ \hline 17 & July & 23 & & 44 \\ \hline 18 & August & 26 & & 41 \\ \hline 19 & September & 21 & & 33 \\ \hline 20 & October & 15 & & 23 \\ \hline 21 & November & 12 & & 26 \\ \hline 22 & Deoember & 14 & & 17 \\ \hline 23 & & & & \\ \hline & & & & \end{tabular} Hint: Definitely not enough data to do a good forecast. You should do a graph based on the existing data whether any trend, seasonal or patterns can be detected. Based on the graph then give your best recommendation. You need to read chapter 8 before you can answer this question. Once again, no right or wrong answer as long as you can justify. (put down your answer anywhere in this sheet. It is not structural. Perfect answers: 5% )
Step by Step Solution
There are 3 Steps involved in it

Get step-by-step solutions from verified subject matter experts