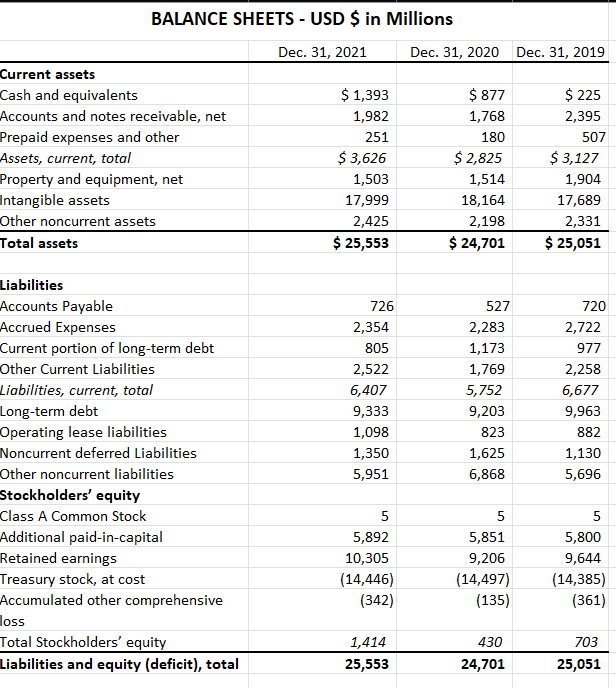
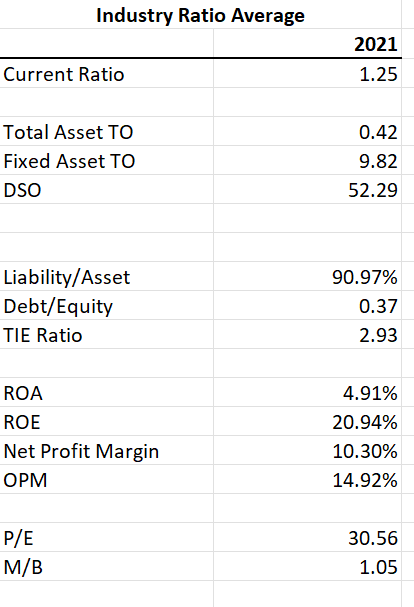
Question: The financial statement for the last three years can be found in Exhibits 1 and 2. The industry averages can be found in Exhibit 3.
The financial statement for the last three years can be found in Exhibits 1 and 2. The industry averages can be found in Exhibit 3. Prepare a 3-5-page report that analyzes the financial condition of Marriott. The introduction should be a summary of the case, the body of the report it should be split in different section describing the company's liquidity, asset management, debt management, profitability, market value and in the conclusion include your recommendations to Marriott. Make sure that you include the heading of each section in your report. Also include the following financial exhibits in excel: o Vertical (common size) analysis of income statement and balance sheet o Horizontal (percent-change) analysis of income statement and balance sheet o Complete ratio analysis (for all 3 years) and industry comparison. For each area, the students need to determine if the pandemic and strategic changes made have resulted in an improved and worsening financial position for the company. ? company's liquidity ? asset management ? debt management ? profitability ? market value Include any recommendation for Marriott going forward, especially in reference to the challenges they face. You will submit both the report analysis and the excel (saved as an .xlsx file). You only need to do the ratios that correspond with the industry average ration in Exhibit 3.
While you can include a table of the ratios in each section of your report, do not put the whole financial statements or financial statement analysis (vertical and horizontal analysis). You will submit your excel file (saved as an .xlsx file) which will show your ratios and other analysis. I should be able to see your formulas and round your values to 2-decimal points.
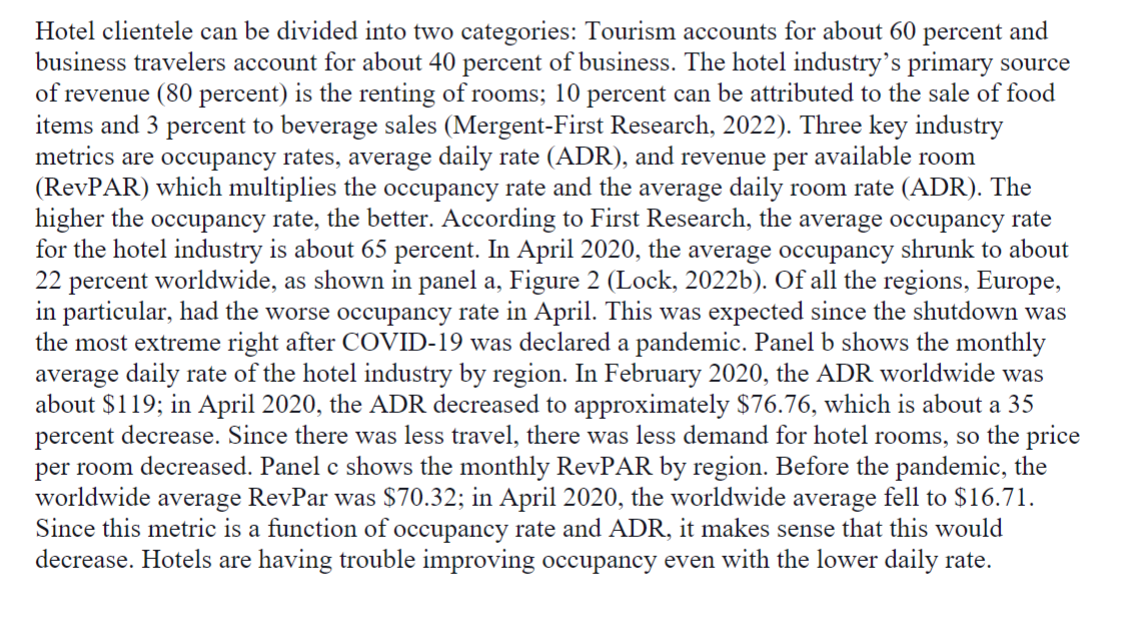
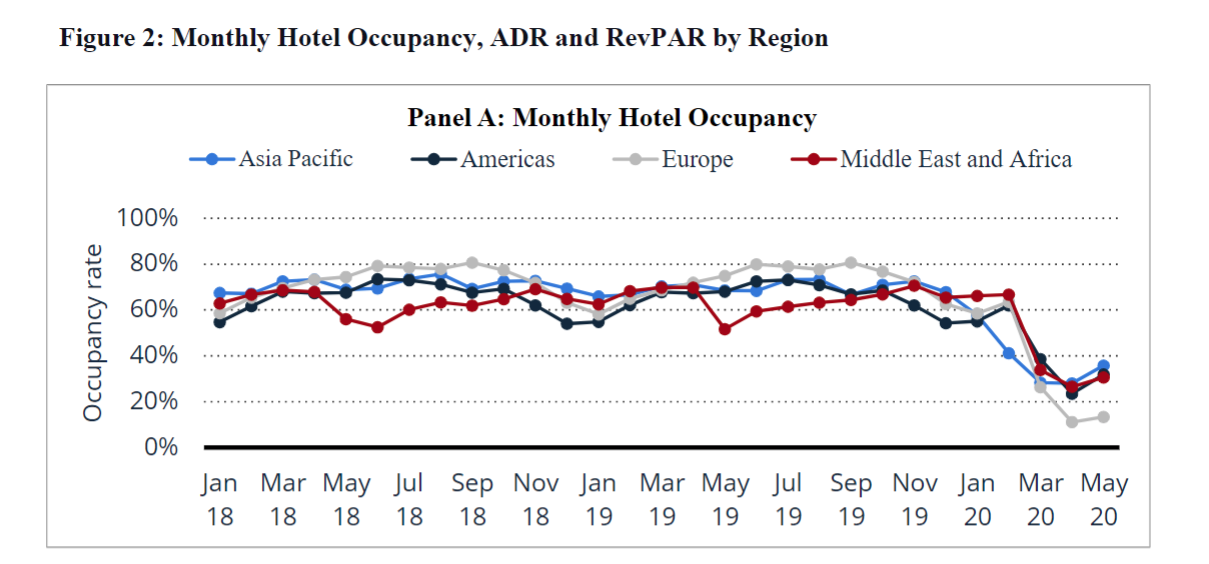
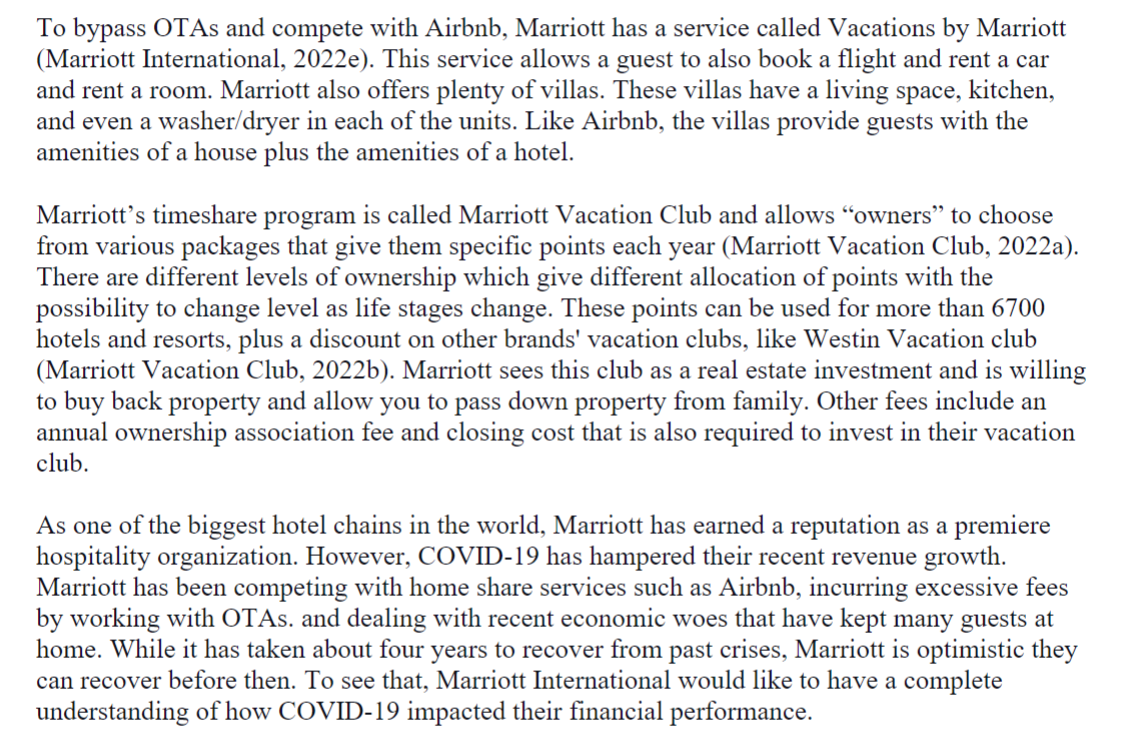
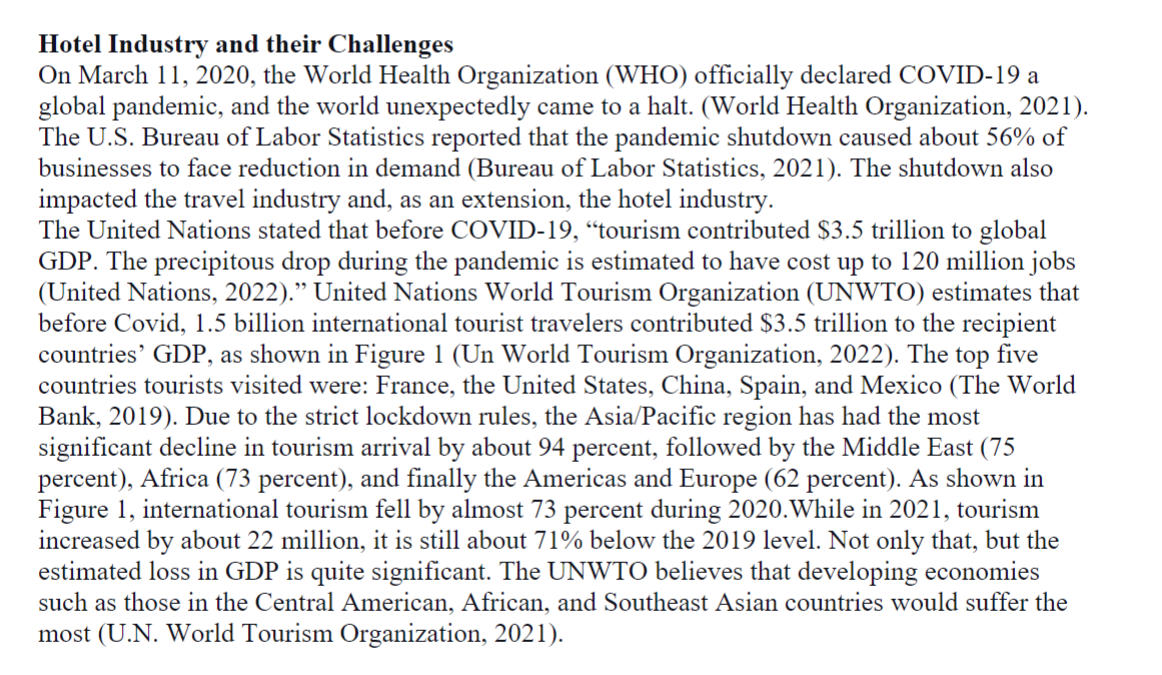
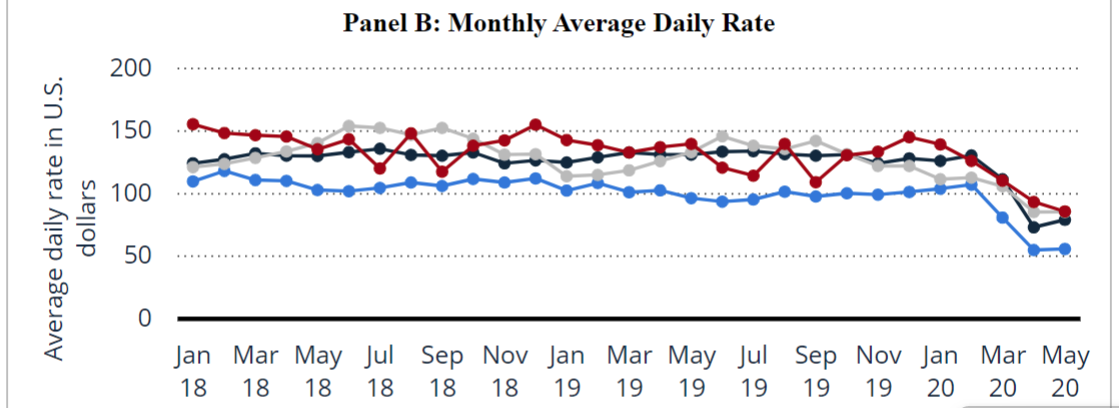
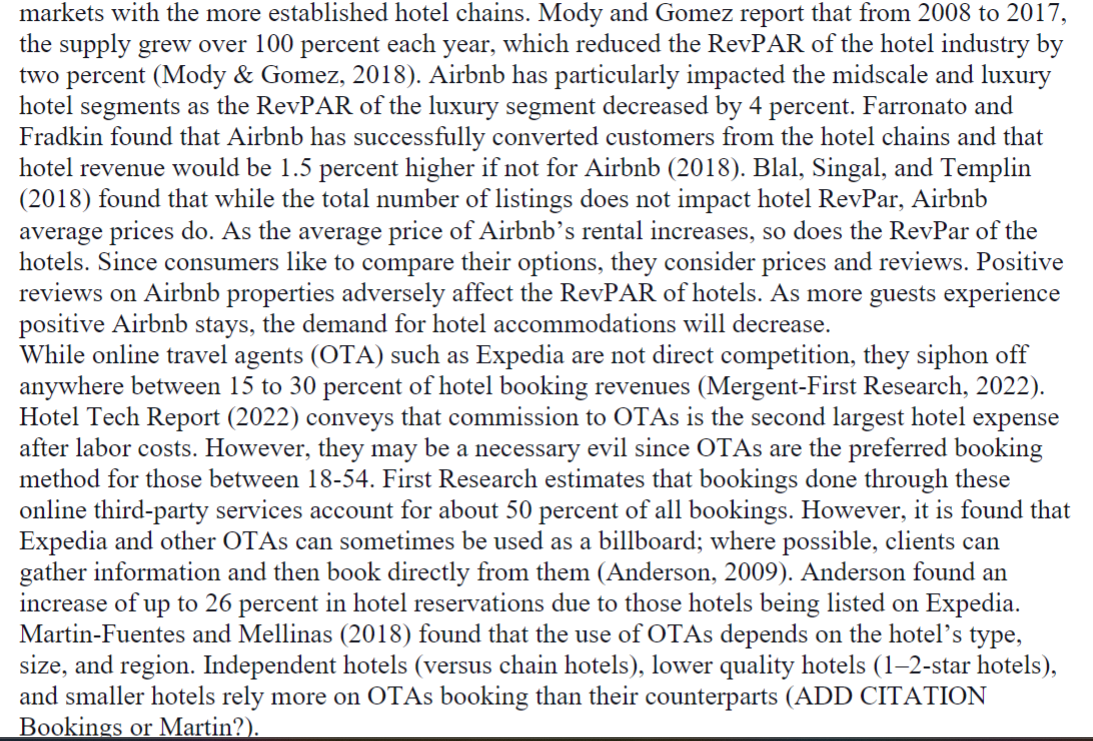
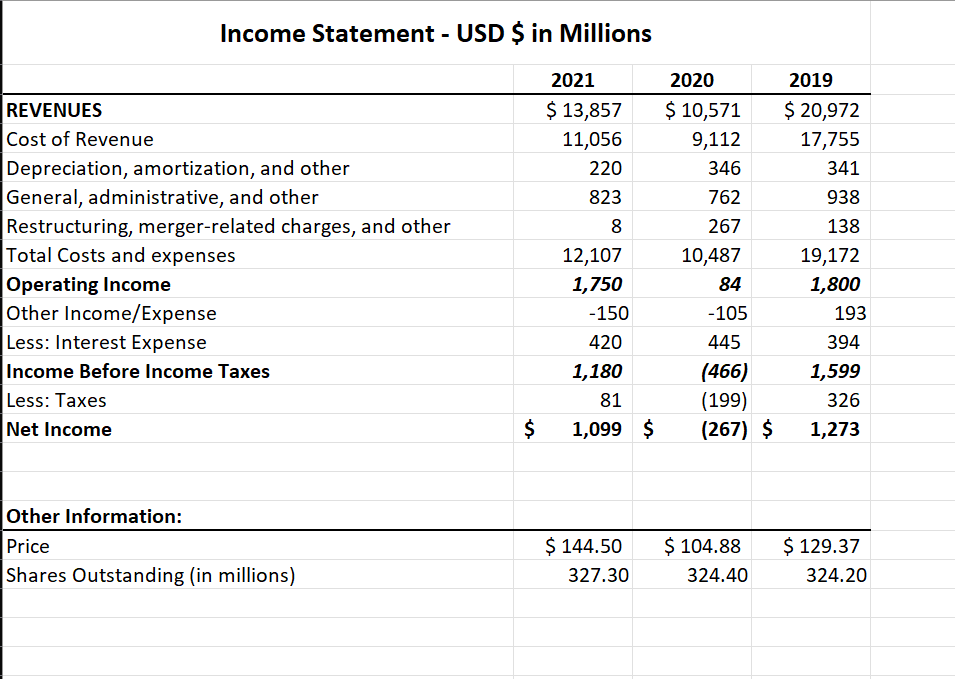
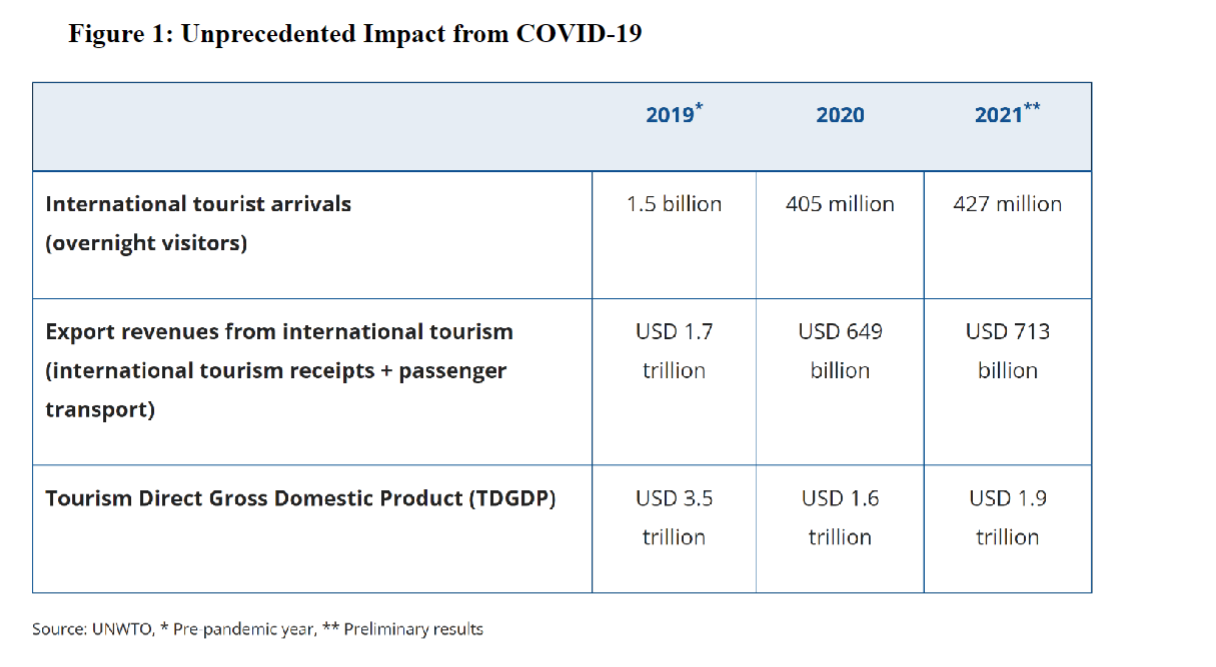
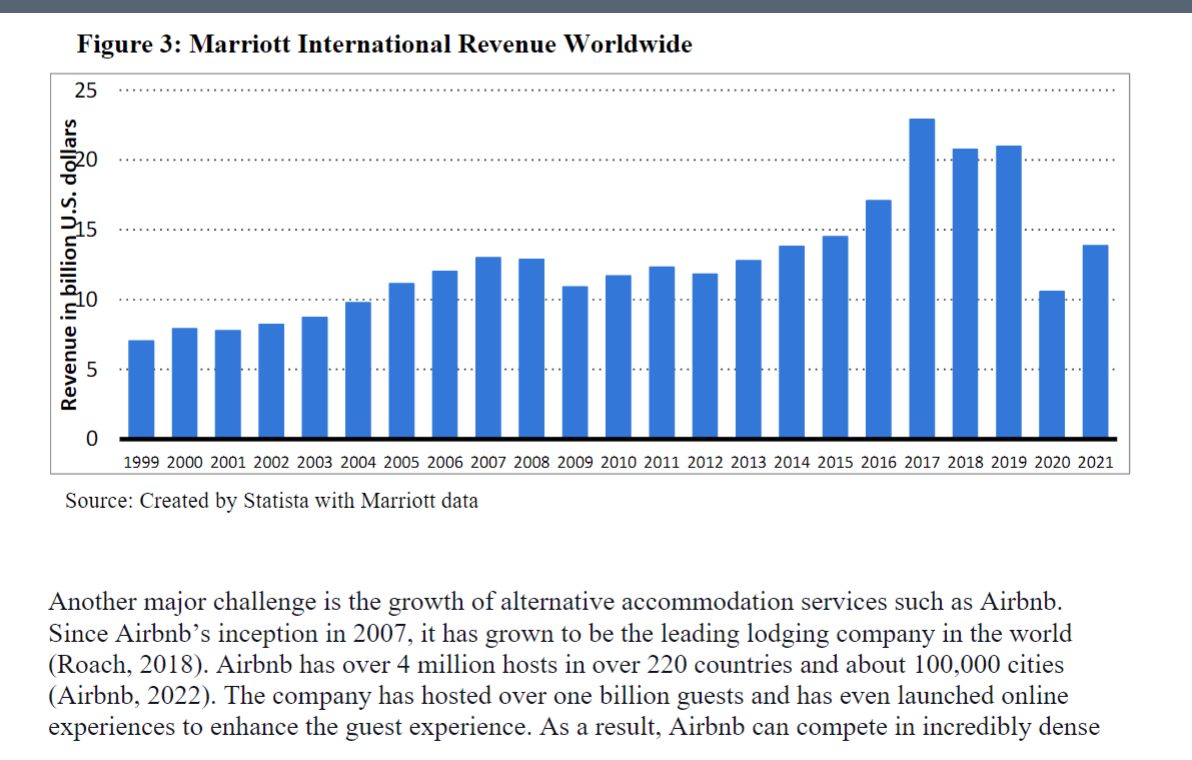
\fHotel clientele can be divided into two categories: Tourism accounts for about 60 percent and business travelers account for about 40 percent of business. The hotel industry's primary source of revenue (80 percent) is the renting of rooms; 10 percent can be attributed to the sale of food items and 3 percent to beverage sales (Mergent-First Research. 2022). Three key industry metrics are occupancy rates. average daily rate (ADR). and revenue per available room (RevPAR) which multiplies the occupancy rate and the average daily room rate (ADR). The higher the occupancy rate. the better. According to First Research. the average occupancy rate for the hotel industry is about 65 percent. In April 2020. the average occupancy shrunk to about 22 percent worldwide. as shown in panel a. Figure 2 (Lock. 2022b). Of all the regions. Europe. in particular. had the worse occupancy rate in April. This was expected since the shutdown was the most extreme right after COVID-19 was declared a pandemic. Panel b shows the monthly average daily rate of the hotel industry by region. In February 2020. the ADR worldwide was about $1 19; in April 2020. the ADR decreased to approximately $76.76. which is about a 35 percent decrease. Since there was less travel. there was less demand for hotel rooms. so the price per room decreased. Panel c shows the monthly RevPAR by region. Before the pandemic. the worldwide average RevPar was $70.32: in April 2020. the worldwide average fell to $16.71. Since this metric is a function of occupancy rate and ADR. it makes sense that this would decrease. Hotels are having trouble improving occupancy even with the lower daily rate. \f\fTo bypass OTAs and compete with Airbnb, Marriott has a service called Vacations by Marriott (Marriott International. 2022c). This service allows a guest to also book a ight and rent a car and rent a room. Marriott also offers plenty of villas. These villas have a living space, kitchen, and even a washer/ dryer in each of the units. Like Airbnb. the villas provide guests with the amenities of a house plus the amenities ofa hotel. Marriott's timeshare program is called Marriott Vacation Club and allows \"owners\" to choose from various packages that give them specific points each year (Marriott Vacation C lub. 2022a). There are different levels of ownership which give different allocation of points with the possibility to change level as life stages change. These points can be used for more than 6700 hotels and resorts. plus a discount on other brands' vacation clubs. like Westin Vacation club (Marriott Vacation C lub. 2022b). Marriott sees this club as a real estate investment and is willing to buy back property and allow you to pass down property from family. Other fees include an annual ownership association fee and closing cost that is also required to invest in their vacation club. As one of the biggest hotel chains in the world. Marriott has earned a reputation as a premiere hospitality organization. However, C OVID-l9 has hampered their recent revenue growth. Marriott has been competing with home share services such as Airbnb, incurring excessive fees by working with OTAs. and dealing with recent economic woes that have kept many guests at home. While it has taken about four years to recover from past crises. Marriott is optimistic they can recover before then. To see that. Marriott International would like to have a complete understanding of how C OVID-19 impacted their nancial performance. Hotel Industry and their Challenges On March 11. 2020. the World Health Organization (WHO) ofcially declared COVID-19 a global pandemic. and the world unexpectedly came to a halt. (World Health Organization. 2021 . The US. Bureau of Labor Statistics reported that the pandemic shutdown caused about 56% of businesses to face reduction in demand (Bureau of Labor Statistics. 2021). The shutdown also impacted the travel industry and. as an extension. the hotel industry. The United Nations stated that before C OVID-l9. "tourism contributed $3.5 trillion to global GDP. The precipitous drop during the pandemic is estimated to have cost up to 120 million jobs (United Nations. 2022).\" United Nations World Tourism Organization (UNWTO) estimates that before Covid. 1.5 billion international tourist travelers contributed $3.5 trillion to the recipient countries' GDP. as shown in Figure 1 (Un World Tourism Organization. 2022). The top five countries tourists visited were: France. the United States. China. Spain. and Mexico (The World Bank. 2019). Due to the strict lockdown rules. the Asia/Pacic region has had the most signicant decline in tourism arrival by about 94 percent. followed by the Middle East (75 percent). Africa (73 percent). and nally the Americas and Europe (6.2 percent). As shown in Figure 1. international tourism fell by almost T3 percent during 2020.While in 2021. tourism increased by about 22 million. it is still about 71% below the 2019 level. Not only that. but the estimated loss in GDP is quite signicant. The UNWTO believes that developing economies such as those in the Central American. African. and Southeast Asian countries would suffer the most (UN. World Tourism Organization. 2021). V \f\fIncome Statement - USD Sin Millions 2021 2020 2019 REVENUES S 13,857 S 10,571 S 20,972 Cost of Revenue 11,056 9,112 17,755 Depreciation, amortization, and other 220 346 341 General, administrative, and other 823 762 938 Restructuring, mergerrelated charges, and other 8 267 138 Total Costs and expenses 12,107 10,487 19,172 Operating Income 1,750 84 1,800 Other Income/Expense 150 105 193 Less: Interest Expense 420 445 394 Income Before Income Taxes 1,180 {466) 1,599 Less: Taxes 81 (199] 326 Net Income S 1,099 S (267) S 1,273 Other Information: Price S 144.50 S 104.88 S 129.37 Shares Outstanding (in millions] 327.30 324.40 324.20 \f\fFigure 3: Marriott International Revenue Worldwide C3 U1 CD Revenue ierilliortys. dwarf. U1 (3 1999 2000 2001 2002 2003 2004 2005 2006 200?r 2008 2009 2010 2011 2012 2013 2014 2015 2015 201? 2018 2019 2020 2021 Source: Created by Statista with Marriott data Another major challenge is the growth of alternative accommodation services such as Airbnb. Since Airbnb's inception in 200?, it has grown to be the leading lodging company in the world (Roach, 2018). Airbnb has over 4 million hosts in over 220 countries and about 100,000 cities (Airbnb, 2022). The company has hosted over one billion guests and has even launched online experiences to enhance the guest experience. As a result, Airbnb can compete in incredibly dense
Step by Step Solution
There are 3 Steps involved in it
1 Expert Approved Answer
Step: 1 Unlock
Question Has Been Solved by an Expert!
Get step-by-step solutions from verified subject matter experts
Step: 2 Unlock
Step: 3 Unlock
Students Have Also Explored These Related Finance Questions!