Question: 1. A memo as described in Part 2 2. A Gantt chart with the schedule table as described in Part 2 along with the answer
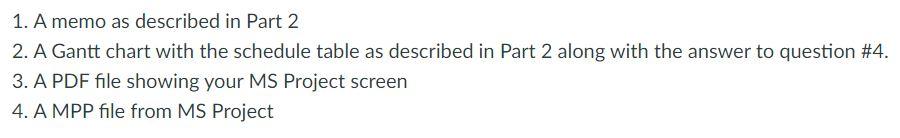
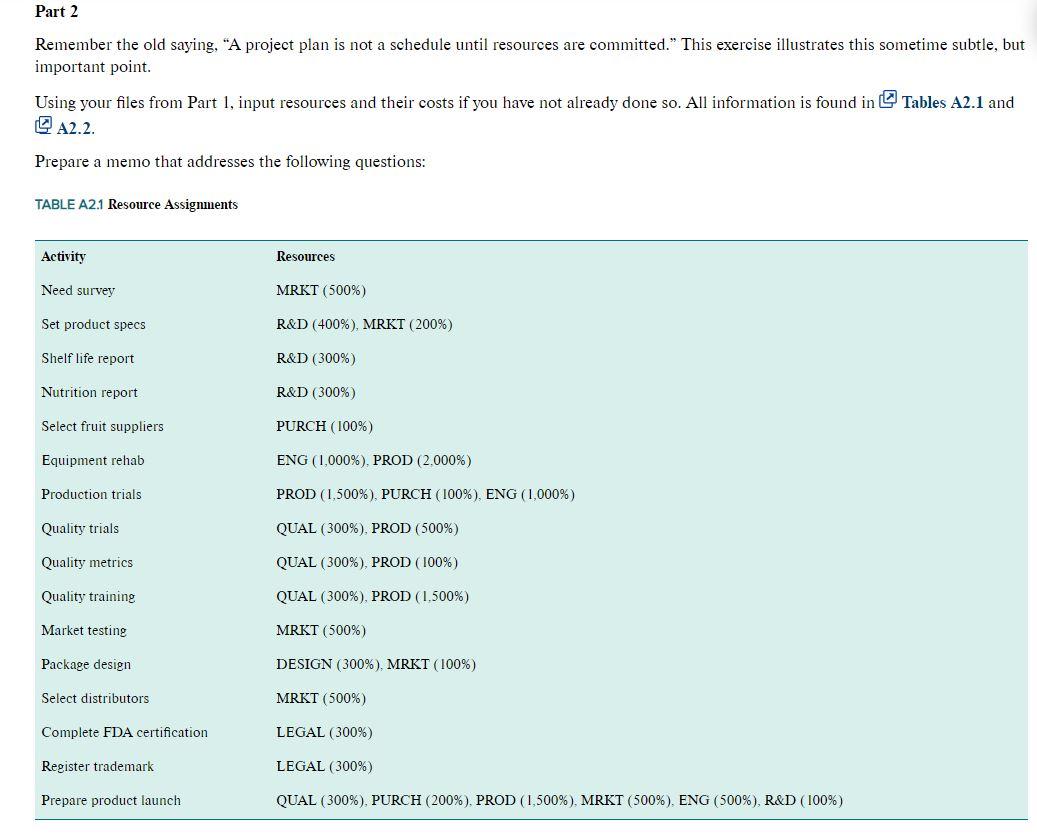
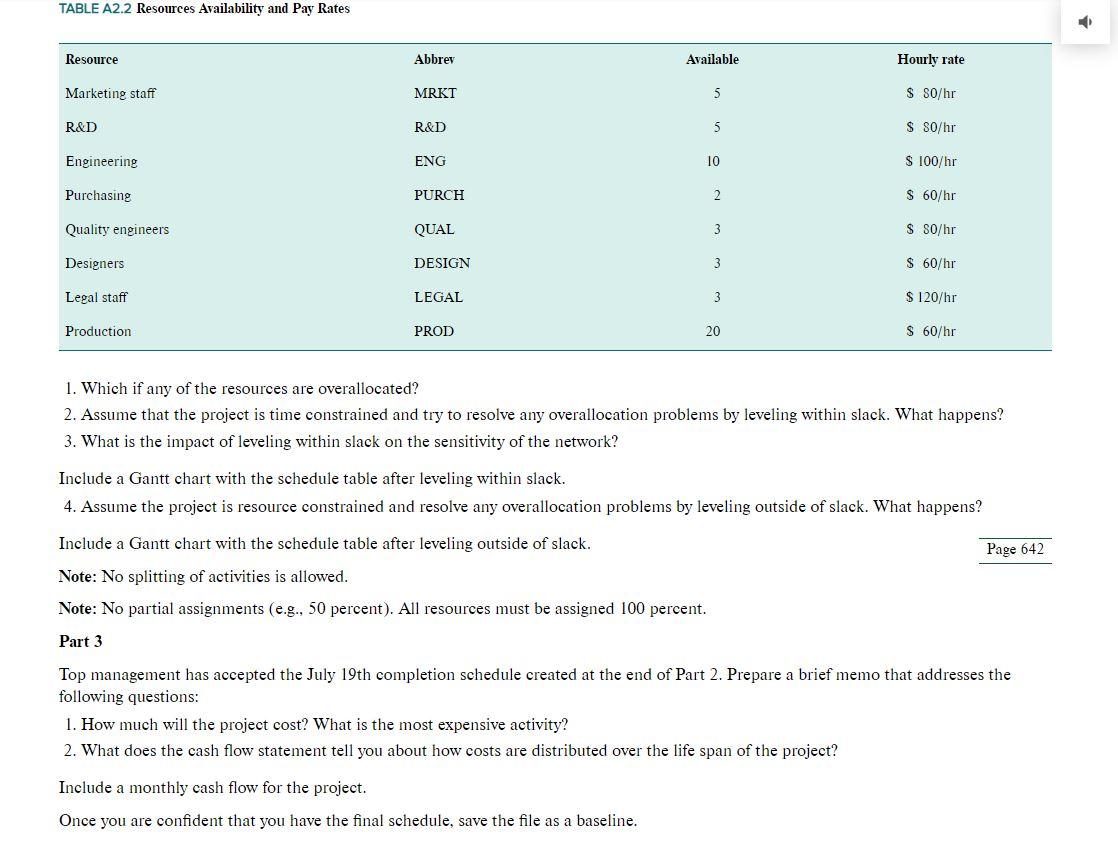
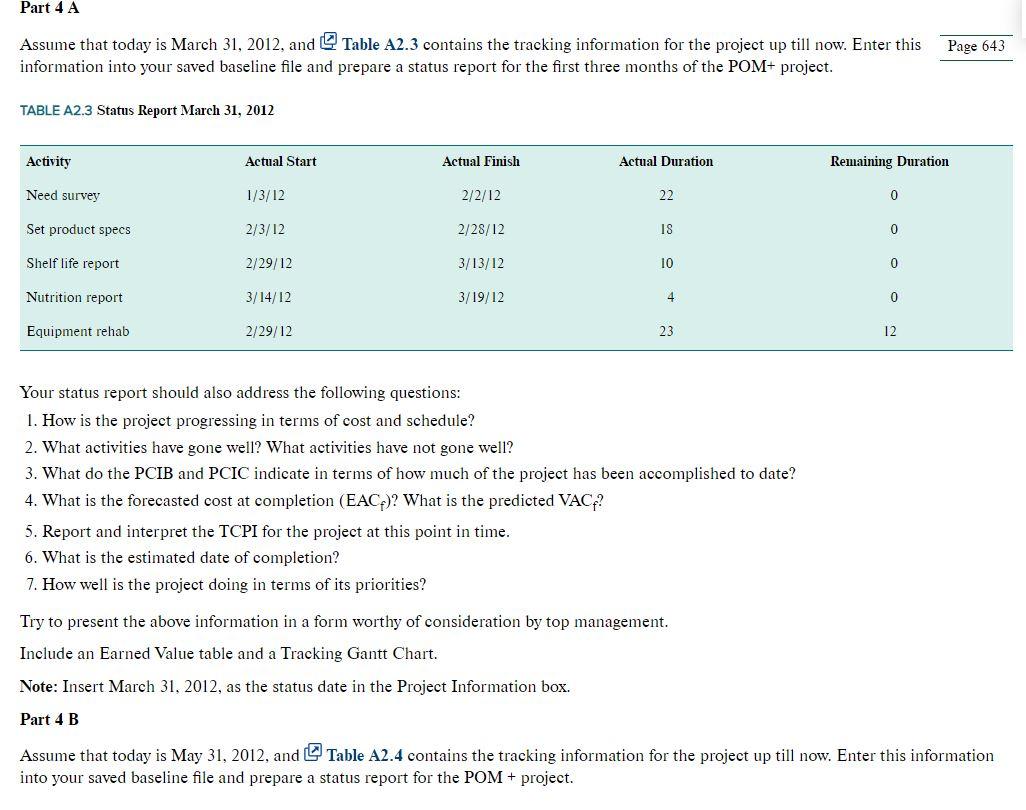
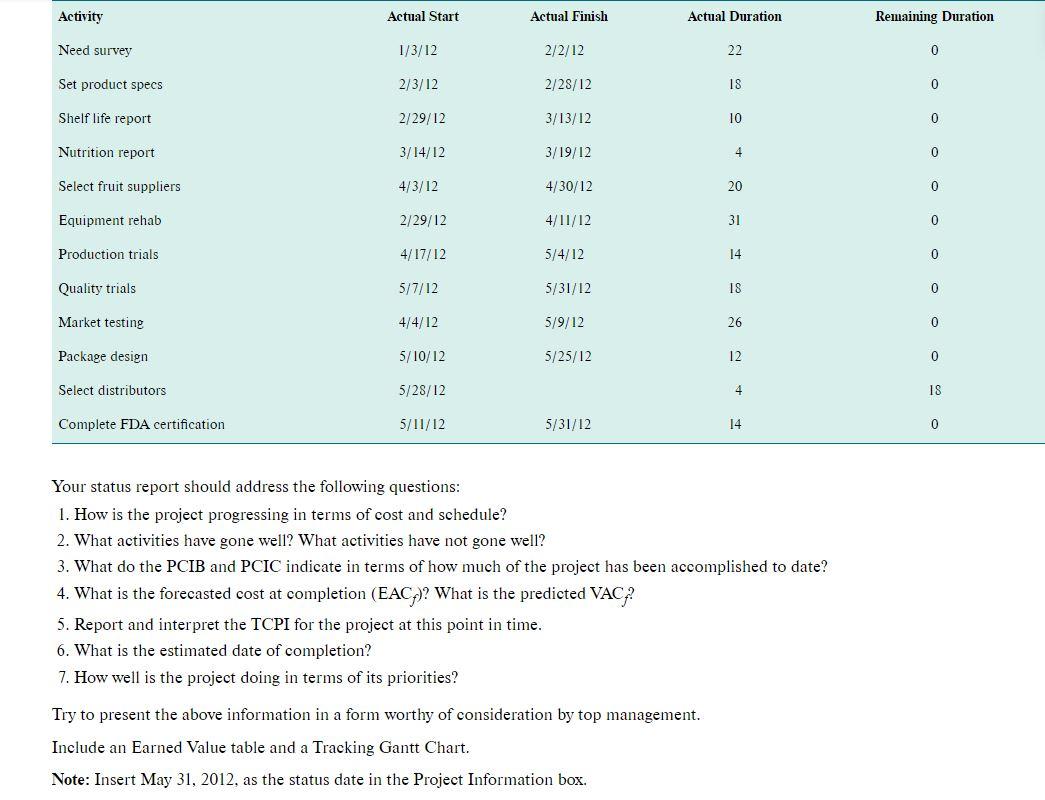
1. A memo as described in Part 2 2. A Gantt chart with the schedule table as described in Part 2 along with the answer to question #4. 3. A PDF file showing your MS Project screen 4. A MPP file from MS Project Part 2 Remember the old saying, "A project plan is not a schedule until resources are committed." This exercise illustrates this sometime subtle, but important point. Using your files from Part 1, input resources and their costs if you have not already done so. All information is found in Tables A2.1 and A2.2. Prepare a memo that addresses the following questions: TABLE A2.1 Resource Assignments Activity Resources Need survey MRKT (500%) Set product specs R&D (400%), MRKT (200%) Shelf life report R&D (300%) Nutrition report R&D (300%) Select fruit suppliers PURCH (100%) Equipment rehab ENG (1,000%), PROD (2.000%) Production trials PROD (1,500%), PURCH (100%), ENG (1,000%) Quality trials QUAL (300%), PROD (500%) Quality metrics QUAL (300%), PROD (100%) Quality training QUAL (300%), PROD (1,500%) Market testing MRKT (500%) Package design DESIGN (300%), MRKT (100%) Select distributors MRKT (500%) Complete FDA certification LEGAL (300%) Register trademark LEGAL (300%) Prepare product launch QUAL (300%), PURCH (200%). PROD (1,500%), MRKT (500%). ENG (500%), R&D (100%) TABLE A2.2 Resources Availability and Pay Rates D Resource Abbrev Available Hourly rate Marketing staff MRKT 5 $ SO/hr R&D R&D 5 $ SO/hr Engineering ENG 10 $ 100/hr Purchasing PURCH 2 $ 60/hr Quality engineers QUAL 3 $ 80/hr Designers DESIGN 3 $ 60/hr Legal staff LEGAL 3 $ 120/hr Production PROD 20 $ 60/hr 1. Which if any of the resources are overallocated? 2. Assume that the project is time constrained and try to resolve any overallocation problems by leveling within slack. What happens? 3. What is the impact of leveling within slack on the sensitivity of the network? Include a Gantt chart with the schedule table after leveling within slack. 4. Assume the project is resource constrained and resolve any overallocation problems by leveling outside of slack. What happens? Include a Gantt chart with the schedule table after leveling outside of slack. Page 642 Note: No splitting of activities is allowed. Note: No partial assignments (e.g., 50 percent). All resources must be assigned 100 percent. Part 3 Top management has accepted the July 19th completion schedule created at the end of Part 2. Prepare a brief memo that addresses the following questions: 1. How much will the project cost? What is the most expensive activity? 2. What does the cash flow statement tell you about how costs are distributed over the life span of the project? Include a monthly cash flow for the project. Once you are confident that you have the final schedule, save the file as a baseline. Part 4 A Assume that today is March 31, 2012, and Table A2.3 contains the tracking information for the project up till now. Enter this information into your saved baseline file and prepare a status report for the first three months of the POM+ project. Page 643 TABLE A2.3 Status Report March 31, 2012 Activity Actual Start Actual Finish Actual Duration Remaining Duration Need survey 1/3/12 2/2/12 22 0 Set product specs 2/3/12 2/28/12 18 0 Shelf life report 2/29/12 3/13/12 10 0 Nutrition report 3/14/12 3/19/12 4 0 Equipment rehab 2/29/12 23 12 Your status report should also address the following questions: 1. How is the project progressing in terms of cost and schedule? 2. What activities have gone well? What activities have not gone well? 3. What do the PCIB and PCIC indicate in terms of how much of the project has been accomplished to date? 4. What is the forecasted cost at completion (EAC)? What is the predicted VAC? 5. Report and interpret the TCPI for the project at this point in time. 6. What is the estimated date of completion? 7. How well is the project doing in terms of its priorities? Try to present the above information in a form worthy of consideration by top management. Include an Earned Value table and a Tracking Gantt Chart. Note: Insert March 31, 2012, as the status date in the Project Information box. Part 4 B Assume that today is May 31, 2012, and Table A2.4 contains the tracking information for the project up till now. Enter this information into your saved baseline file and prepare a status report for the POM + project. Activity Actual Start Actual Finish Actual Duration Remaining Duration Need survey 1/3/12 2/2/12 22 0 Set product specs 2/3/12 2/28/12 18 0 Shelf life report 2/29/12 3/13/12 10 0 Nutrition report 3/14/12 3/19/12 4 0 Select fruit suppliers 4/3/12 4/30/12 20 0 Equipment rehab 2/29/12 4/11/12 31 0 Production trials 4/17/12 5/4/12 14 0 Quality trials 5/7/12 5/31/12 18 0 Market testing 4/4/12 5/9/12 26 0 Package design 5/10/12 5/25/12 12 0 Select distributors 5/28/12 4 IS Complete FDA certification 5/11/12 5/31/12 14 0 Your status report should address the following questions: 1. How is the project progressing in terms of cost and schedule? 2. What activities have gone well? What activities have not gone well? 3. What do the PCIB and PCIC indicate in terms of how much of the project has been accomplished to date? 4. What is the forecasted cost at completion (EAC)? What is the predicted VAC;? 5. Report and interpret the TCPI for the project at this point in time. 6. What is the estimated date of completion? 7. How well is the project doing in terms of its priorities? Try to present the above information in a form worthy of consideration by top management. Include an Earned Value table and a Tracking Gantt Chart. Note: Insert May 31, 2012, as the status date in the Project Information box. 1. A memo as described in Part 2 2. A Gantt chart with the schedule table as described in Part 2 along with the answer to question #4. 3. A PDF file showing your MS Project screen 4. A MPP file from MS Project Part 2 Remember the old saying, "A project plan is not a schedule until resources are committed." This exercise illustrates this sometime subtle, but important point. Using your files from Part 1, input resources and their costs if you have not already done so. All information is found in Tables A2.1 and A2.2. Prepare a memo that addresses the following questions: TABLE A2.1 Resource Assignments Activity Resources Need survey MRKT (500%) Set product specs R&D (400%), MRKT (200%) Shelf life report R&D (300%) Nutrition report R&D (300%) Select fruit suppliers PURCH (100%) Equipment rehab ENG (1,000%), PROD (2.000%) Production trials PROD (1,500%), PURCH (100%), ENG (1,000%) Quality trials QUAL (300%), PROD (500%) Quality metrics QUAL (300%), PROD (100%) Quality training QUAL (300%), PROD (1,500%) Market testing MRKT (500%) Package design DESIGN (300%), MRKT (100%) Select distributors MRKT (500%) Complete FDA certification LEGAL (300%) Register trademark LEGAL (300%) Prepare product launch QUAL (300%), PURCH (200%). PROD (1,500%), MRKT (500%). ENG (500%), R&D (100%) TABLE A2.2 Resources Availability and Pay Rates D Resource Abbrev Available Hourly rate Marketing staff MRKT 5 $ SO/hr R&D R&D 5 $ SO/hr Engineering ENG 10 $ 100/hr Purchasing PURCH 2 $ 60/hr Quality engineers QUAL 3 $ 80/hr Designers DESIGN 3 $ 60/hr Legal staff LEGAL 3 $ 120/hr Production PROD 20 $ 60/hr 1. Which if any of the resources are overallocated? 2. Assume that the project is time constrained and try to resolve any overallocation problems by leveling within slack. What happens? 3. What is the impact of leveling within slack on the sensitivity of the network? Include a Gantt chart with the schedule table after leveling within slack. 4. Assume the project is resource constrained and resolve any overallocation problems by leveling outside of slack. What happens? Include a Gantt chart with the schedule table after leveling outside of slack. Page 642 Note: No splitting of activities is allowed. Note: No partial assignments (e.g., 50 percent). All resources must be assigned 100 percent. Part 3 Top management has accepted the July 19th completion schedule created at the end of Part 2. Prepare a brief memo that addresses the following questions: 1. How much will the project cost? What is the most expensive activity? 2. What does the cash flow statement tell you about how costs are distributed over the life span of the project? Include a monthly cash flow for the project. Once you are confident that you have the final schedule, save the file as a baseline. Part 4 A Assume that today is March 31, 2012, and Table A2.3 contains the tracking information for the project up till now. Enter this information into your saved baseline file and prepare a status report for the first three months of the POM+ project. Page 643 TABLE A2.3 Status Report March 31, 2012 Activity Actual Start Actual Finish Actual Duration Remaining Duration Need survey 1/3/12 2/2/12 22 0 Set product specs 2/3/12 2/28/12 18 0 Shelf life report 2/29/12 3/13/12 10 0 Nutrition report 3/14/12 3/19/12 4 0 Equipment rehab 2/29/12 23 12 Your status report should also address the following questions: 1. How is the project progressing in terms of cost and schedule? 2. What activities have gone well? What activities have not gone well? 3. What do the PCIB and PCIC indicate in terms of how much of the project has been accomplished to date? 4. What is the forecasted cost at completion (EAC)? What is the predicted VAC? 5. Report and interpret the TCPI for the project at this point in time. 6. What is the estimated date of completion? 7. How well is the project doing in terms of its priorities? Try to present the above information in a form worthy of consideration by top management. Include an Earned Value table and a Tracking Gantt Chart. Note: Insert March 31, 2012, as the status date in the Project Information box. Part 4 B Assume that today is May 31, 2012, and Table A2.4 contains the tracking information for the project up till now. Enter this information into your saved baseline file and prepare a status report for the POM + project. Activity Actual Start Actual Finish Actual Duration Remaining Duration Need survey 1/3/12 2/2/12 22 0 Set product specs 2/3/12 2/28/12 18 0 Shelf life report 2/29/12 3/13/12 10 0 Nutrition report 3/14/12 3/19/12 4 0 Select fruit suppliers 4/3/12 4/30/12 20 0 Equipment rehab 2/29/12 4/11/12 31 0 Production trials 4/17/12 5/4/12 14 0 Quality trials 5/7/12 5/31/12 18 0 Market testing 4/4/12 5/9/12 26 0 Package design 5/10/12 5/25/12 12 0 Select distributors 5/28/12 4 IS Complete FDA certification 5/11/12 5/31/12 14 0 Your status report should address the following questions: 1. How is the project progressing in terms of cost and schedule? 2. What activities have gone well? What activities have not gone well? 3. What do the PCIB and PCIC indicate in terms of how much of the project has been accomplished to date? 4. What is the forecasted cost at completion (EAC)? What is the predicted VAC;? 5. Report and interpret the TCPI for the project at this point in time. 6. What is the estimated date of completion? 7. How well is the project doing in terms of its priorities? Try to present the above information in a form worthy of consideration by top management. Include an Earned Value table and a Tracking Gantt Chart. Note: Insert May 31, 2012, as the status date in the Project Information box


