

Question: 1. A SIMPLE SUPPLY CHAIN MAP Present a graphic visualization (i.e., a map) of the AirWing product supply chain. Highlight the ZBCs position and function
1. A SIMPLE SUPPLY CHAIN MAP Present a graphic visualization (i.e., a map) of the AirWing product supply chain. Highlight the ZBCs position and function in the supply chain. Show the positions of key suppliers and customers. Include key data points on this diagram such as lead times, distances, and costs.
2. AN ANALYSIS OF PAST DEMAND AND FUTURE FORECAST FOR THE AIRWING BICYCLE The ZBC team knows that focusing on managing orders and on-hand-inventory is critical to meeting their customers needs and controlling costs. To do this, ZBC knows they need to understand their past demand patterns as well as their future forecasts. With that in mind, ZBC has asked your team to help them better understand demand for their AirWing Bicycle. In your presentation please include a clear, concise data visualization of demand for the Airwing - and use that graphic as the basis for an informed discussion of observed demand patterns.
3. A BASIC INVENTORY MANAGEMENT MODEL (IN EXCEL) As mentioned in the textbook case, ZBC wants your help in developing an inventory plan for 2022. Specifically, your client has asked you to mock-up a flexible Excel model that can respond to changes in forecasted demand and calculate the following for the Airwing Bicycle. Economic Order Quantity (EOQ) Re-Order Point (ROP) Safety Stock (SS) Your Excel model should consider ZBCs 95% Customer Service Policy and also calculate a bottom-line Total Cost associated with a given ordering scenario. By building a flexible model that can quickly calculate total cost, your team can help ZBC respond to real-time changes in forecasted demand. You interviewed Geoff Smith, the procurement manager at ZBC and he shared the following insights . . . I know our demand is seasonal, but I really want to get a handle on what is happening month-to-month. We have the option of setting EOQ, ROP, and SS in January and then riding out the rest of the year at those fixed levels - or - we could adjust ordering and inventory levels quarterly. I am hoping your team can help meunderstand the cost differential between those two options, as well as suggest other ways we can optimize our business process. ADVICE: Use the data provided in the textbook case as baseline inputs for your Excel model. Once the model is built, try out different ordering scenarios (aka recalculate EOQ, ROP, and SS over different time periods as Geoff requested). Remember, the goal is to minimize total cost, while still meeting demand (at a 95% customer service level).
4. PROVIDE OTHER INVENTORY MANAGEMENT RECOMMENDATIONS In addition to the more quantitative analysis in parts one and two (above), Geoff and the team at ZBC are interested in hearing about any other suggestions that might help them better manage their inventory, control costs, and serve their customers. Feel free to research and highlight any industry best practices related to inventory management and/or propose specific initiatives that could help ZBC in this area.
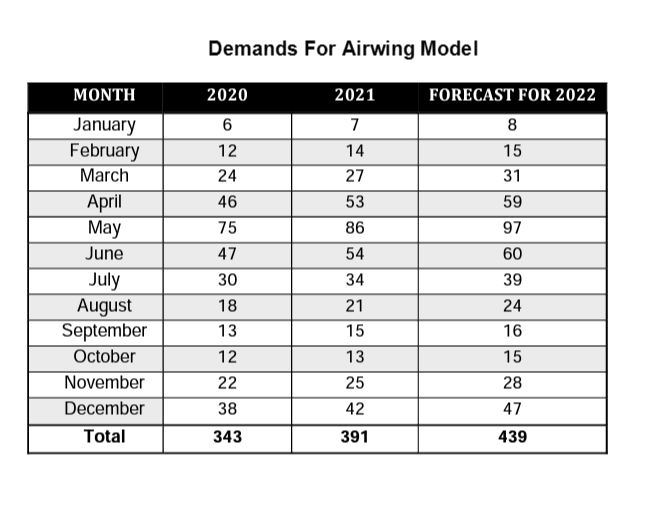
Demands For Airwing Model
Step by Step Solution
There are 3 Steps involved in it

Get step-by-step solutions from verified subject matter experts