

Question: 1 (a) to (e) please? Suffering a lot :( 1. The following data represent the difference in scores between the winning and losing teams in
1 (a) to (e) please?
Suffering a lot :(
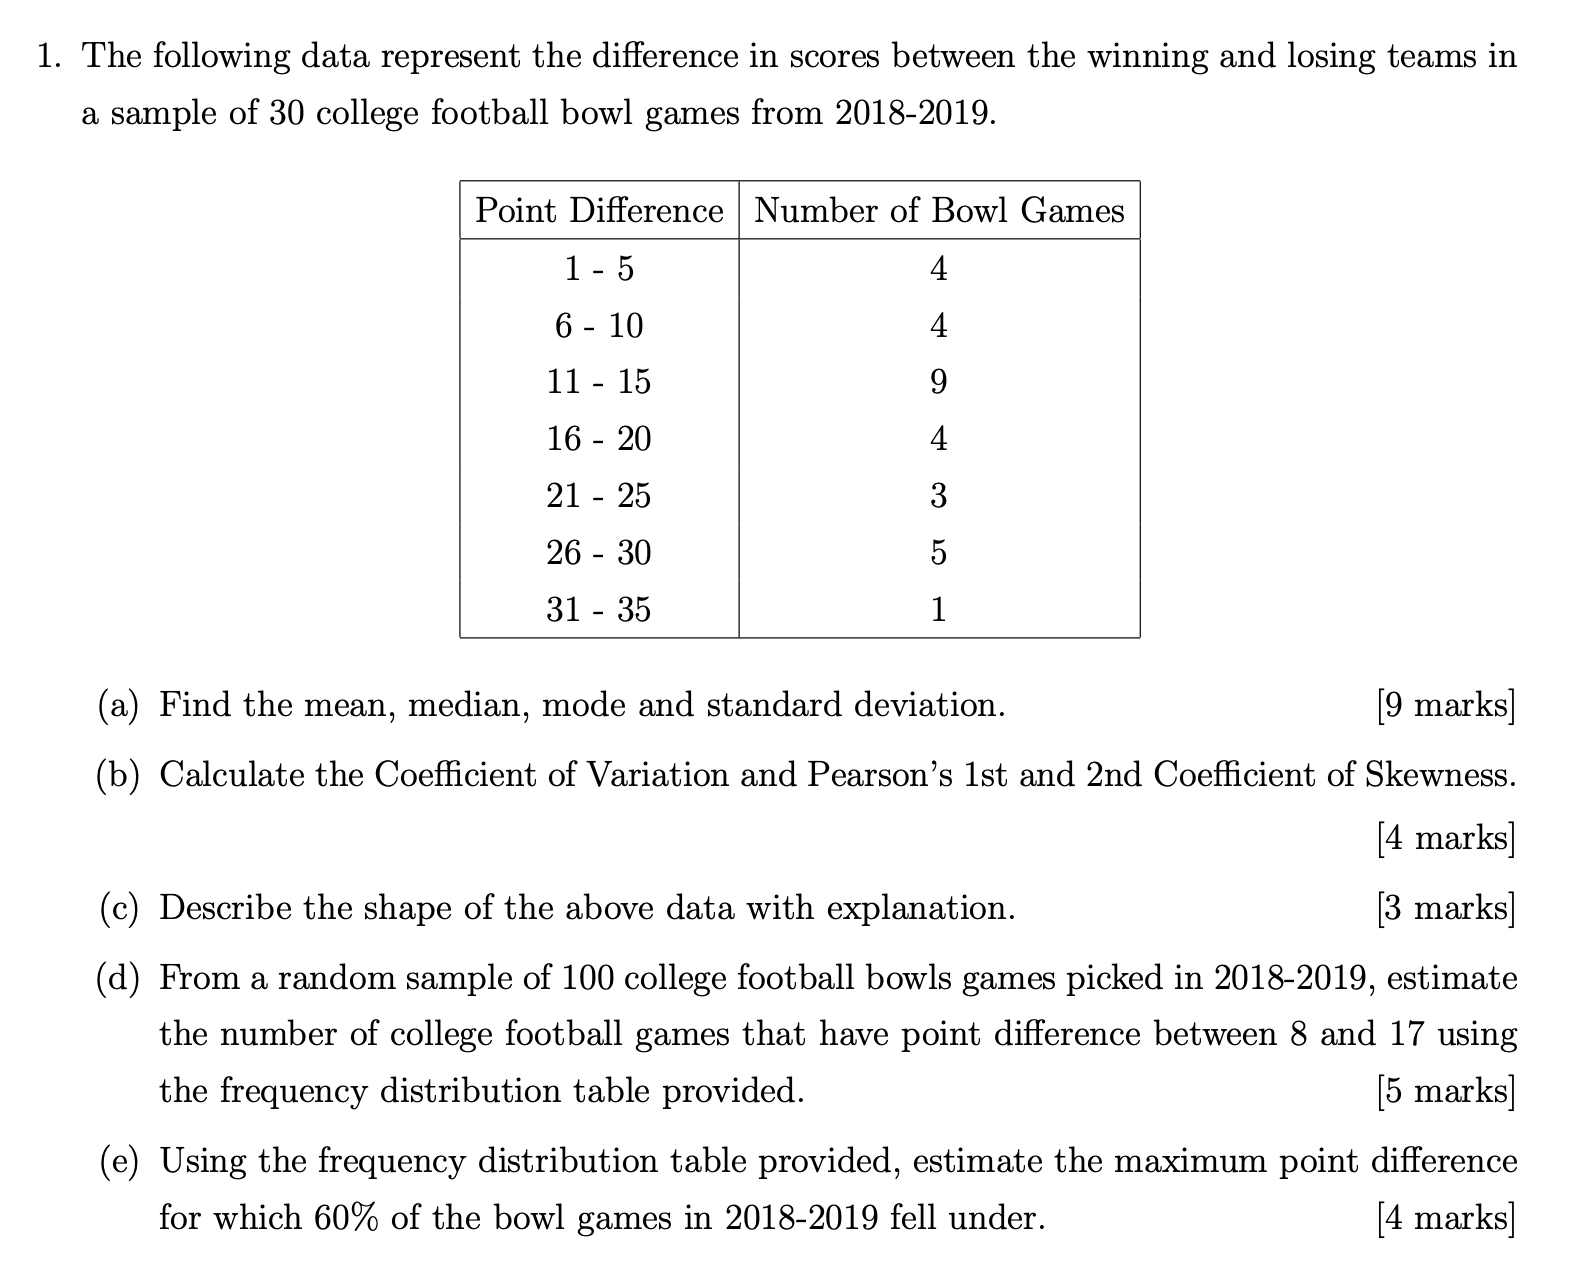
1. The following data represent the difference in scores between the winning and losing teams in a sample of 30 college football bowl games from 20182019. Point Difference Number of Bowl Games (a) Find the mean, median, mode and standard deviation. [9 marks] (b) Calculate the Coe'icient of Variation and Pearson's 1st and 2nd Coefcient of Skewness. [4 marks] (c) Describe the shape of the above data with explanation. [3 marks] ((1) From a random sample of 100 college football bowls games picked in 2018-2019, estimate the number of college football games that have point difference between 8 and 17 using the frequency distribution table provided. [5 marks] (e) Using the frequency distribution table provided, estimate the maximum point difference for which 60% of the bowl games in 20182019 fell under. [4 marks]
Step by Step Solution
There are 3 Steps involved in it

Get step-by-step solutions from verified subject matter experts