

Question: ANSWER THESE QUESTION thanks The following data represent the length of life, in seconds, of 50 fruit flies subject to a new spray in a
ANSWER THESE QUESTION thanks
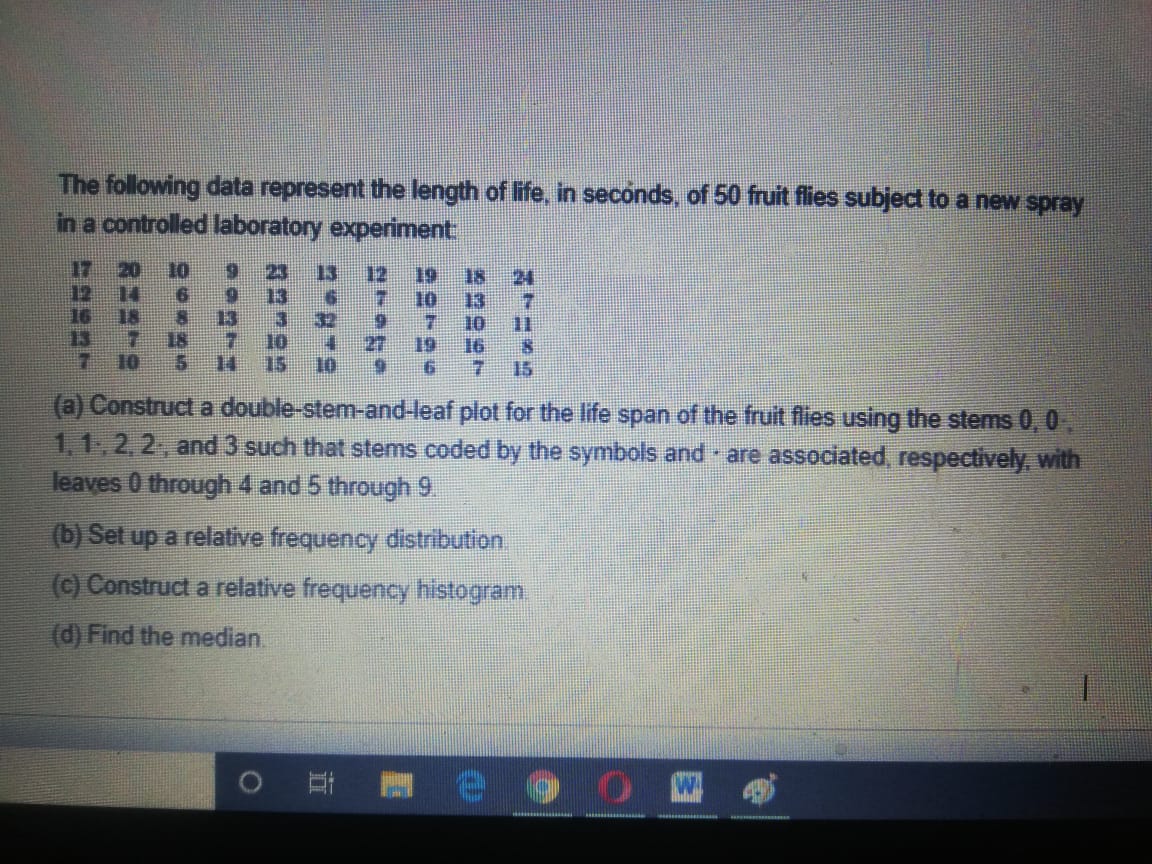
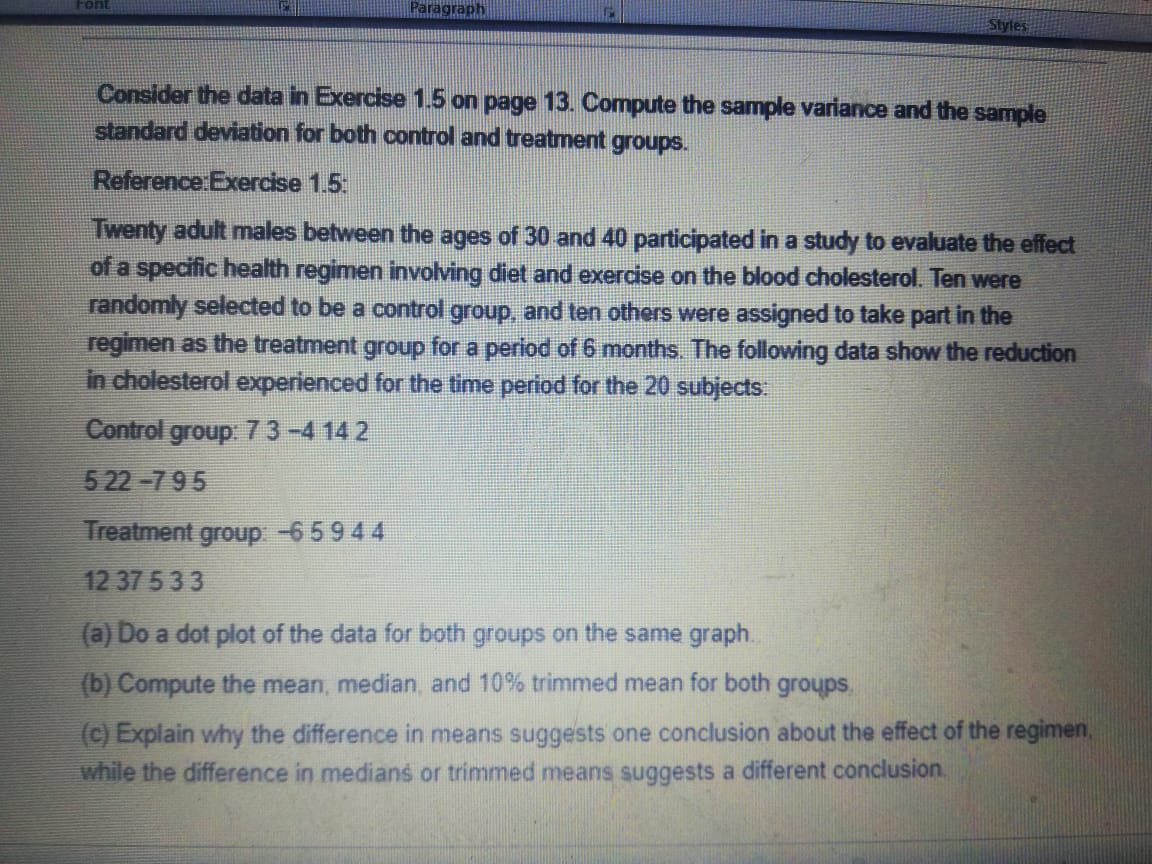
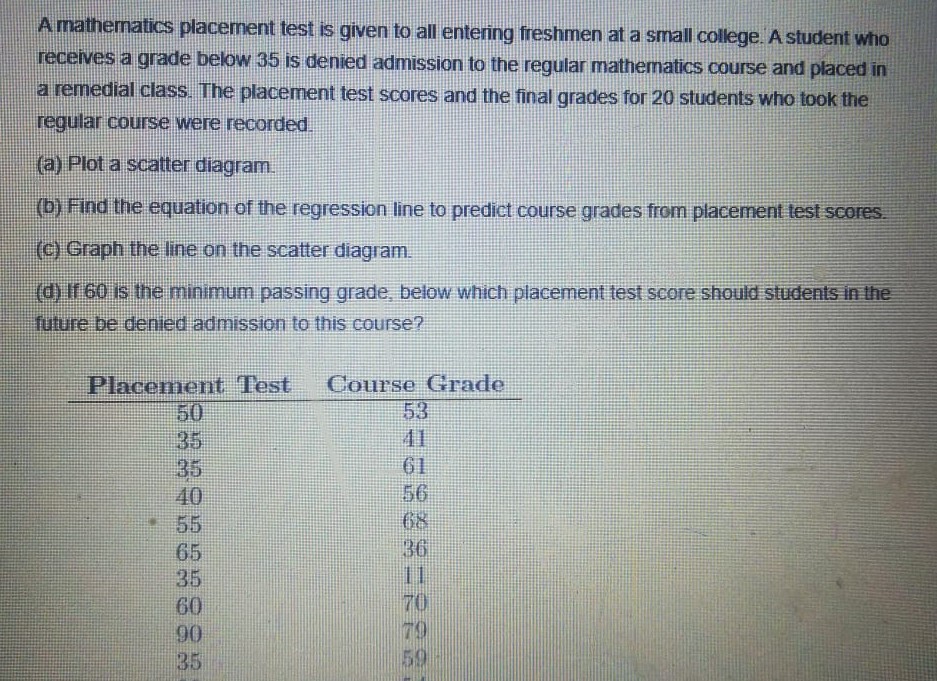
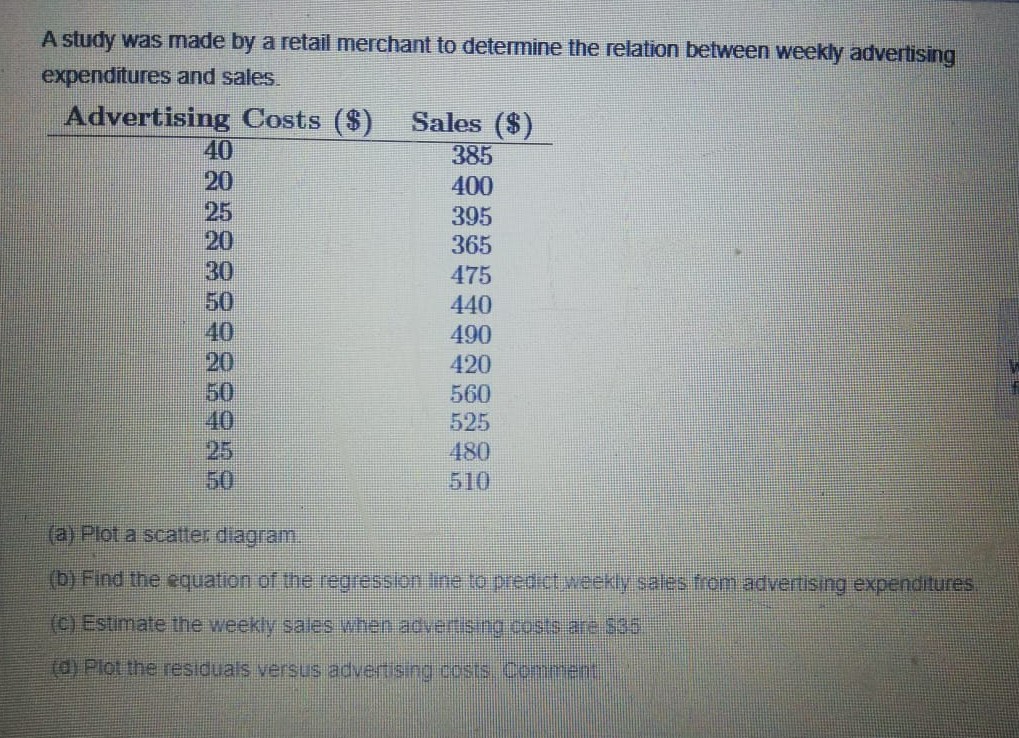
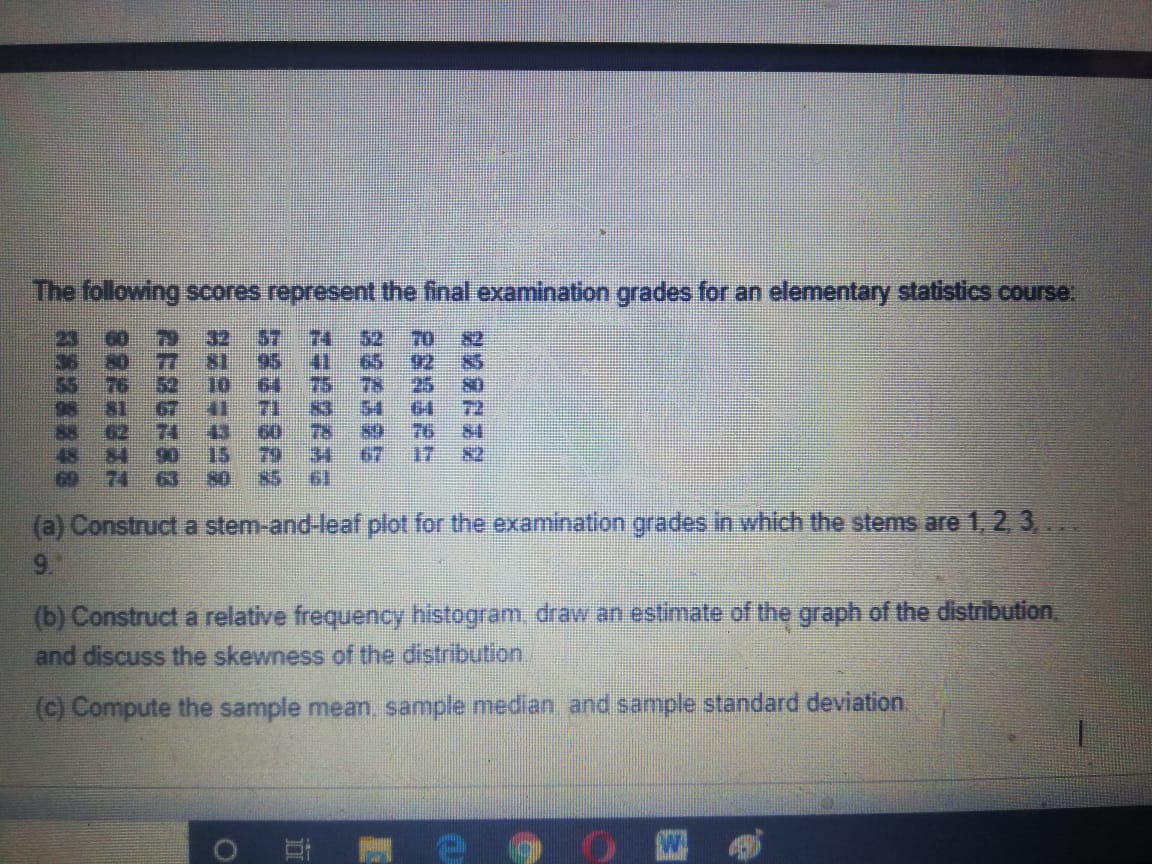
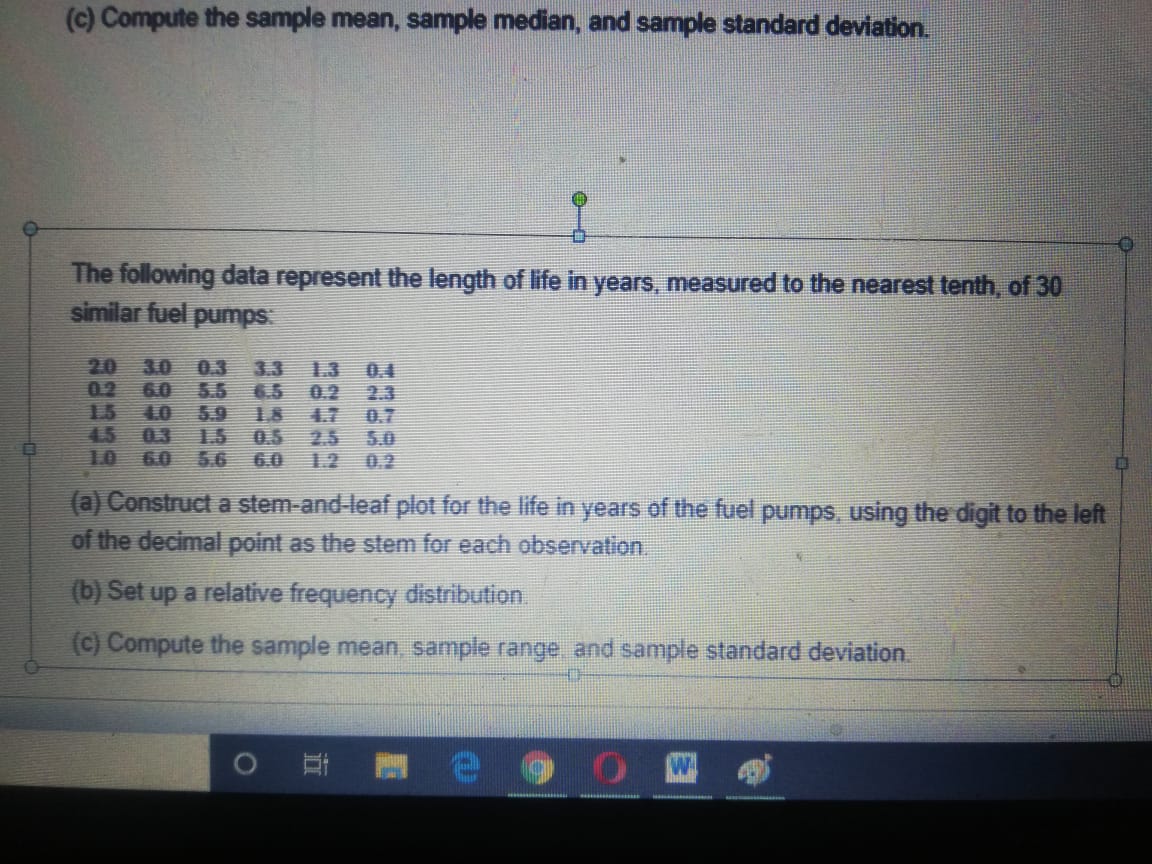
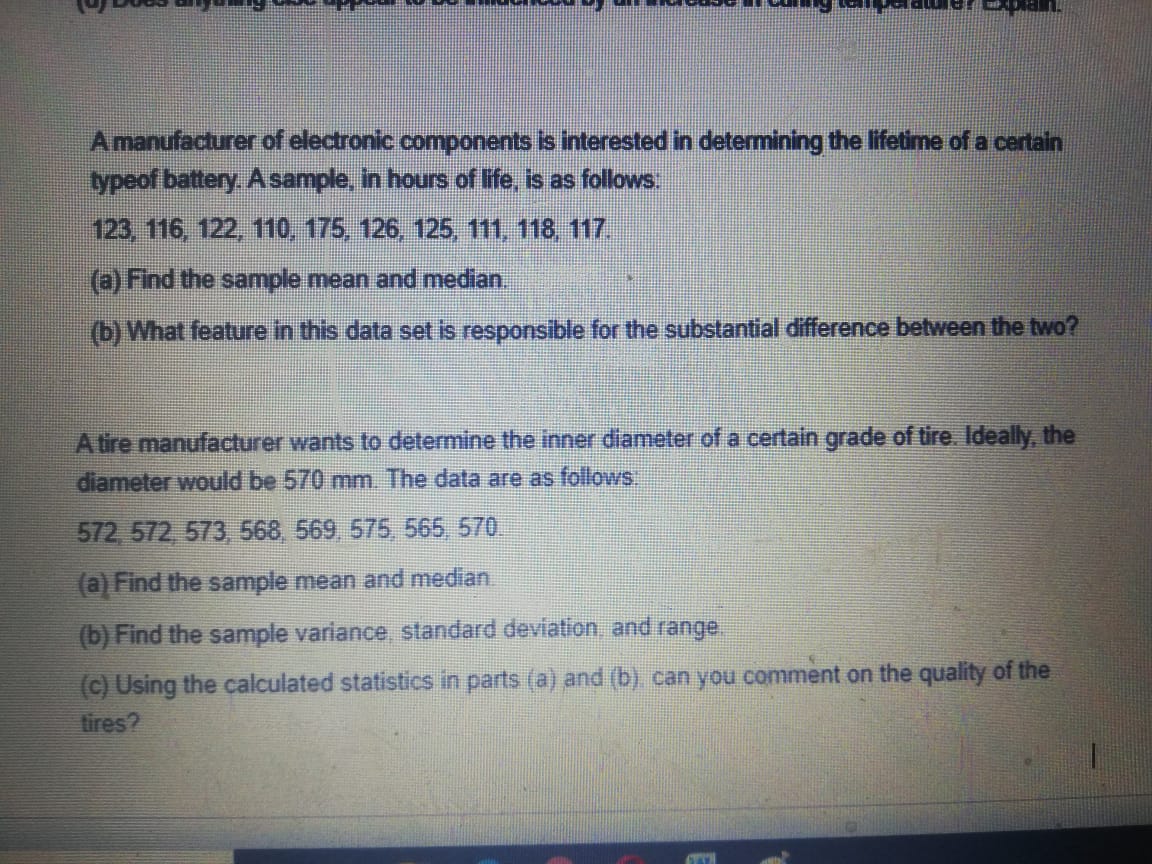
The following data represent the length of life, in seconds, of 50 fruit flies subject to a new spray in a controlled laboratory experiment (a) Construct a double-stem-and-leaf plot for the life span of the fruit flies using the stems 0, 0 1, 1., 2, 2, and 3 such that stems coded by the symbols and . are associated, respectively, with leaves 0 through 4 and 5 through 9 (b) Set up a relative frequency distribution (c) Construct a relative frequency histogram (d) Find the median OConsider the data in Exercise 1.5 on page 13. Compute the sample variance and the sample standard deviation for both control and treatment groups. Reference:Exercise 1.5: Twenty adult males between the ages of 30 and 40 participated in a study to evaluate the effect of a specific health regimen involving diet and exercise on the blood cholesterol. Ten were randomly selected to be a control group, and ten others were assigned to take part in the regimen as the treatment group for a period of 6 months. The following data show the reduction in cholesterol experienced for the time period for the 20 subjects: Control group: 7 3 -4 14 2 522-795 Treatment group -6 5 9 4 4 12 37 5 3 3 (a) Do a dot plot of the data for both groups on the same graph. (b) Compute the mean, median, and 10% trimmed mean for both groups (c) Explain why the difference in means suggests one conclusion about the effect of the regimen while the difference in medians or trimmed means suggests a different conclusion,A mathematics placement test is given to all entering freshmen at a small college. A student who receives a grade below 35 is denied admission to the regular mathematics course and placed in a remedial class. The placement test scores and the final grades for 20 students who took the regular course were recorded (a) Plot a scatter diagram. (b) Find the equation of the regression line to predict course grades from placement test scores. (c) Graph the line on the scatter diagram. (d) If 60 is the minimum passing grade, below which placement test score should students in the future be denied admission to this course? Placement Test Course Grade 50 53 35 11 35 61 40 56A study was made by a retail merchant to determine the relation between weekly advertising expenditures and sales. Advertising Costs Sales ($) 40 385 20 400 25 395 20 365 475 440 490 685688 420 560 525 25 480 50 510 a) Plot a scatter diagram. (b) Find the equation of the regression line to predict weekly sales from advertising expenditures (C) Estimate the weekly sales when advertising costs are $98 (d) Plot the residuals versus advertising costs ContingentThe following scores represent the final examination grades for an elementary statistics course KENEAR (a) Construct a stem-and-leaf plot for the examination grades in which the stems are 1, 2, 3, 9 (b) Construct a relative frequency histogram, draw an estimate of the graph of the distribution and discuss the skewness of the distribution (c) Compute the sample mean. sample median, and sample standard deviation(c) Compute the sample mean, sample median, and sample standard deviation. The following data represent the length of life in years, measured to the nearest tenth, of 30 similar fuel pumps 20 30 3.3 1.3 0.4 02 60 0.2 2.3 0.7 45 03 0.5 2.5 5.0 1.0 50 5.6 6.0 1.2 0.2 (a) Construct a stem-and-leaf plot for the life in years of the fuel pumps, using the digit to the left of the decimal point as the stem for each observation (b) Set up a relative frequency distribution (c) Compute the sample mean, sample range and sample standard deviation O OA manufacturer of electronic components is interested in determining the lifetime of a certain typeof battery. A sample, in hours of life, is as follows 123, 116, 122, 110, 175, 126, 125, 111, 118, 117. (a) Find the sample mean and median. (b) What feature in this data set is responsible for the substantial difference between the two? A tire manufacturer wants to determine the inner diameter of a certain grade of tire. Ideally, the diameter would be 570 mm. The data are as follows 572, 572, 573, 568, 569, 575, 565, 570 (a) Find the sample mean and median (b) Find the sample variance standard deviation, and range (c) Using the calculated statistics in parts (a) and (b), can you comment on the quality of the tires
Step by Step Solution
There are 3 Steps involved in it

Get step-by-step solutions from verified subject matter experts