

Question: 1) a)increase b)decrease 2) a)declines b) improves 3) a)increase b)decrease The following graph shows a decrease in short-run aggregate supply (AS) in a hypothetical economy

1) a)increase b)decrease 2) a)declines b) improves 3) a)increase b)decrease
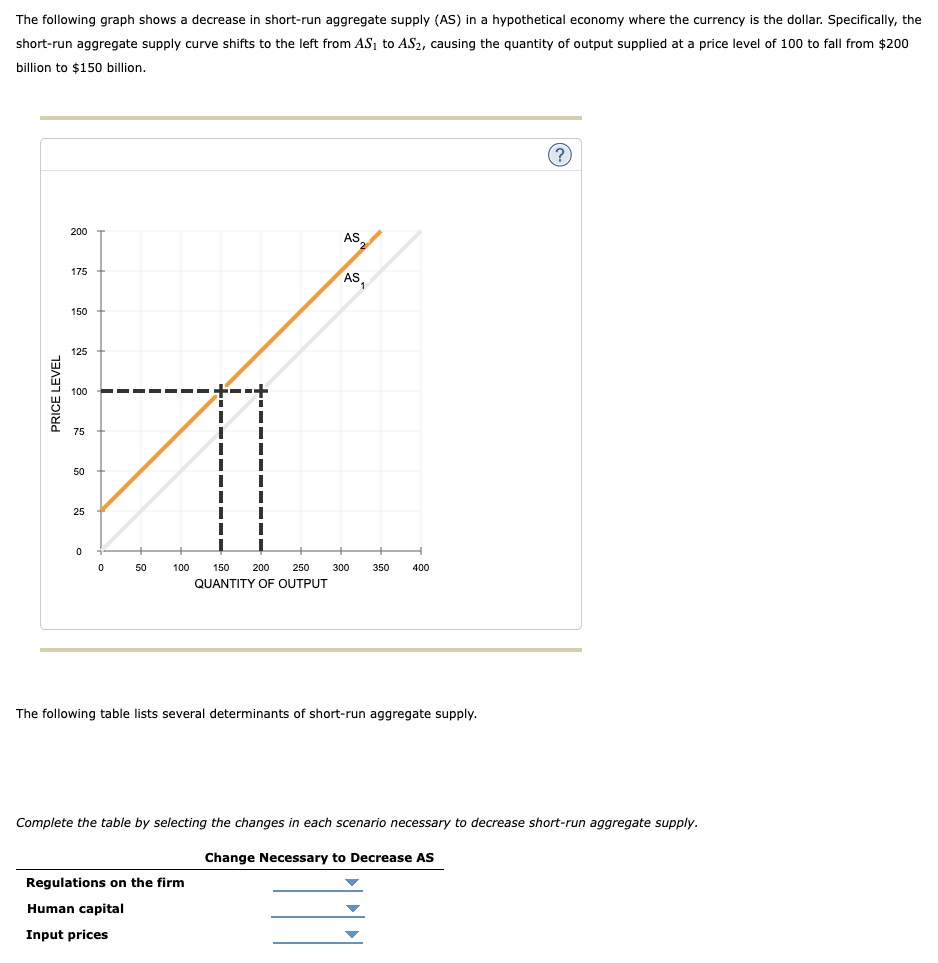
The following graph shows a decrease in short-run aggregate supply (AS) in a hypothetical economy where the currency is the dollar. Specifically, the short-run aggregate supply curve shifts to the left from AS, to A$2, causing the quantity of output supplied at a price level of 100 to fall from $200 billion to $150 billion. (? ) 200 AS, 175 AS 150 125 PRICE LEVEL 100 75 25 50 100 150 200 250 300 350 400 QUANTITY OF OUTPUT The following table lists several determinants of short-run aggregate supply. Complete the table by selecting the changes in each scenario necessary to decrease short-run aggregate supply. Change Necessary to Decrease AS Regulations on the firm Human capital Input prices
Step by Step Solution
There are 3 Steps involved in it

Get step-by-step solutions from verified subject matter experts