

Question: B. Graphical Analysis. 1. The Solow model equations: a. the production function b. the investment per worker function as a function of capital stock per

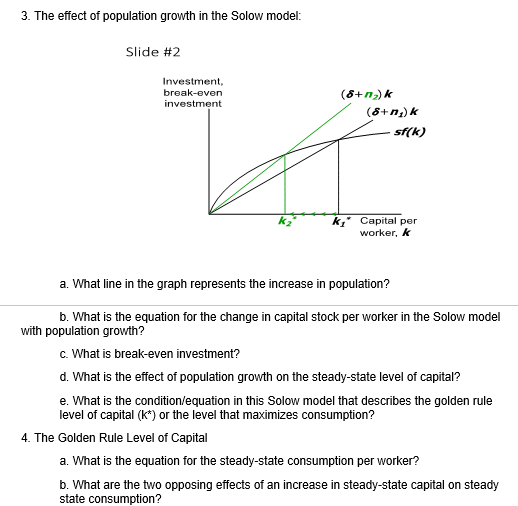
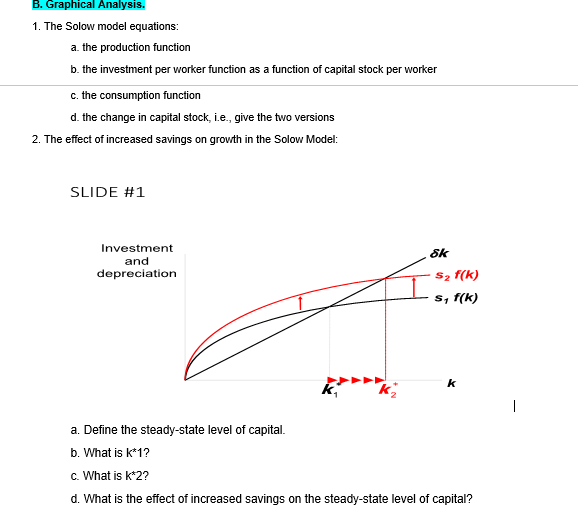

B. Graphical Analysis. 1. The Solow model equations: a. the production function b. the investment per worker function as a function of capital stock per worker c. the consumption function d. the change in capital stock, i.e., give the two versions 2. The effect of increased savings on growth in the Solow Model: SLIDE #1 Investment and depreciation I Sa f(k) , f ( k ) KZ k - a. Define the steady-state level of capital. b. What is k*1? C. What is k*2? d. What is the effect of increased savings on the steady-state level of capital?3. The effect of population growth in the Solow model: Slide #2 Investment. break-even (5+12)k investment sf(k) K2 k,* Capital per worker, k a. What line in the graph represents the increase in population? b. What is the equation for the change in capital stock per worker in the Solow model with population growth? c. What is break-even investment? d. What is the effect of population growth on the steady-state level of capital? e. What is the condition/equation in this Solow model that describes the golden rule level of capital (k*) or the level that maximizes consumption? 4. The Golden Rule Level of Capital a. What is the equation for the steady-state consumption per worker? b. What are the two opposing effects of an increase in steady-state capital on steady state consumption
Step by Step Solution
There are 3 Steps involved in it

Get step-by-step solutions from verified subject matter experts