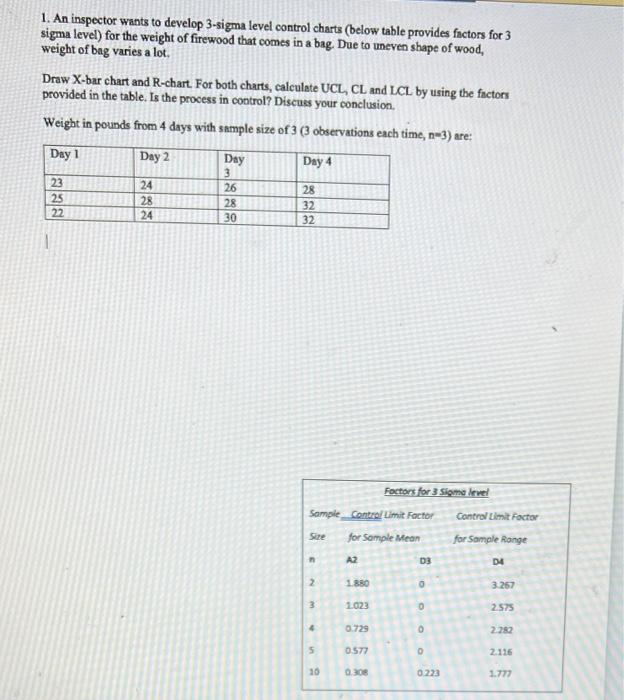
Question: 1. An inspector wants to develop 3-sigma level control charts (below table provides factors for 3 sigma level) for the weight of firewood that comes

1. An inspector wants to develop 3-sigma level
1. An inspector wants to develop 3-sigma level control charts (below table provides factors for 3 sigma level) for the weight of firewood that comes in a bag. Due to uneven shape of wood, weight of bag varies a lot. Draw X-bar chart and R-chart. For both charts, calculate UCL, CL and LCL by using the factors provided in the table. Is the process in control? Discuss your conclusion. Weight in pounds from 4 days with sample size of 3 ( 3 observations each time, n=3) are: 2. The number of weekly customer complaint is monitored at a large hotel. Draw the 3-sigma level cchart using the data below. Calculate and show values for UCL, CL, and LCL. Is everything under control? Discuss your conclusion. 3. A small town is concerned about public reaction to its new high voltage electric tower project that is currently in progress. In order to measure resident's perception, a weekly survey is conducted. Each time, a sample of 100 residents is surveyed. The results to date are shown below. The P-chart can be used to monitor the public reaction. Calculate UCL, CL, and LCL at the 1.96 sigma level (z=1.96). Draw the graph and plot data. Is everything under control

Step by Step Solution

There are 3 Steps involved in it

1 Expert Approved Answer
Step: 1 Unlock blur-text-image
Question Has Been Solved by an Expert!

Get step-by-step solutions from verified subject matter experts

Step: 2 Unlock
Step: 3 Unlock

Students Have Also Explored These Related General Management Questions!