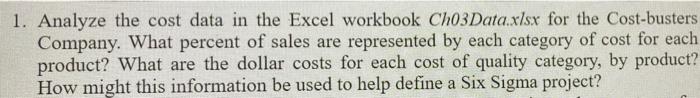
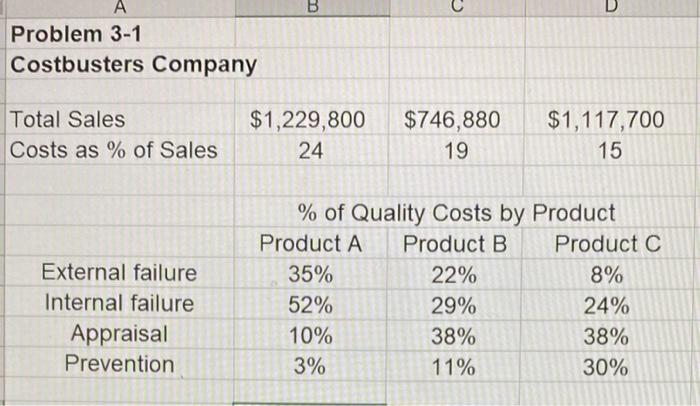
Question: 1. Analyze the cost data in the Excel workbook Ch03Data.xlsx for the Cost-busters Company. What percent of sales are represented by each category of cost

1. Analyze the cost data in the Excel workbook
1. Analyze the cost data in the Excel workbook Ch03Data.xlsx for the Cost-busters Company. What percent of sales are represented by each category of cost for each product? What are the dollar costs for each cost of quality category, by product? How might this information be used to help define a Six Sigma project? B D A Problem 3-1 Costbusters Company Total Sales Costs as % of Sales $1,229,800 24 $746,880 19 $1,117,700 15 External failure Internal failure Appraisal Prevention % of Quality Costs by Product Product A Product B Product C 35% 22% 8% 52% 29% 24% 10% 38% 38% 3% 11% 30%

Step by Step Solution

There are 3 Steps involved in it

1 Expert Approved Answer
Step: 1 Unlock blur-text-image
Question Has Been Solved by an Expert!

Get step-by-step solutions from verified subject matter experts

Step: 2 Unlock
Step: 3 Unlock

Students Have Also Explored These Related General Management Questions!