Question: 1 and 2a only . please do 2a on excel file wnd show all formulas and as much help as possible so i can put
1 and 2a only . please do 2a on excel file wnd show all formulas and as much help as possible so i can put into an excel file .please and thank you so much
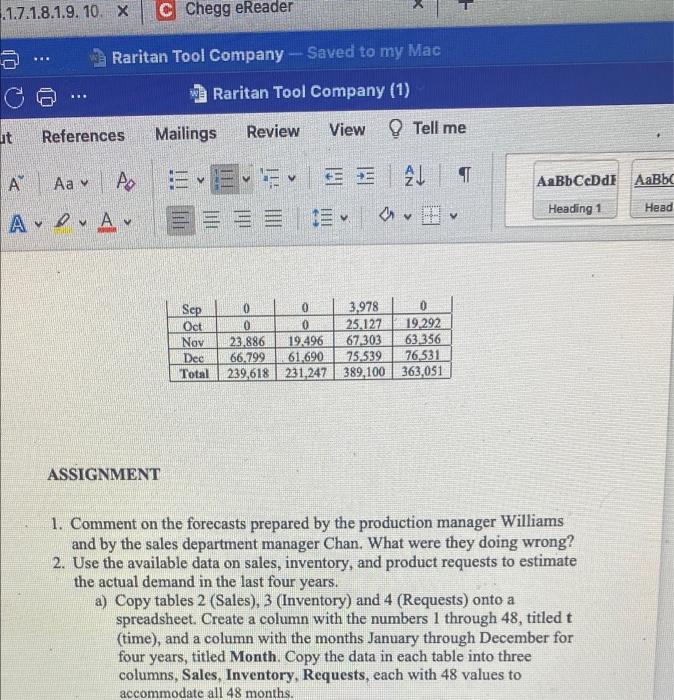
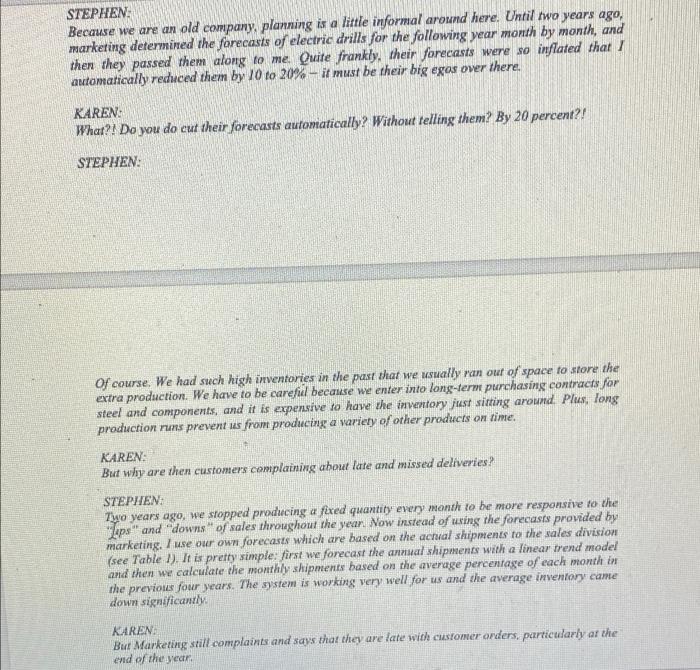
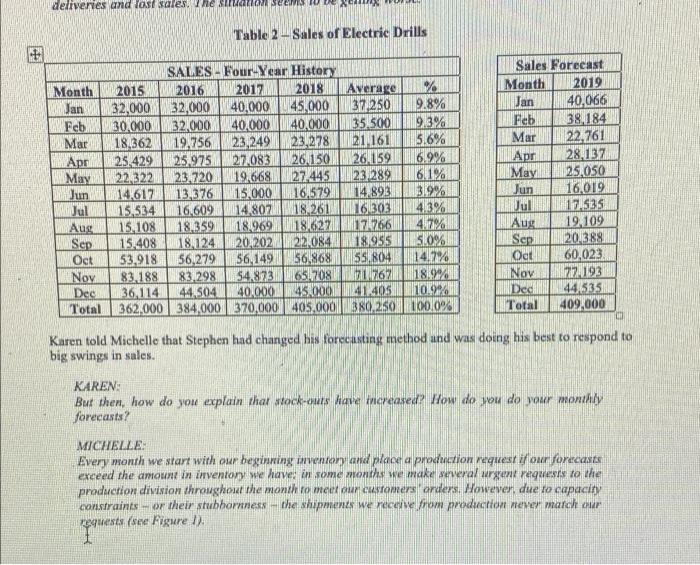
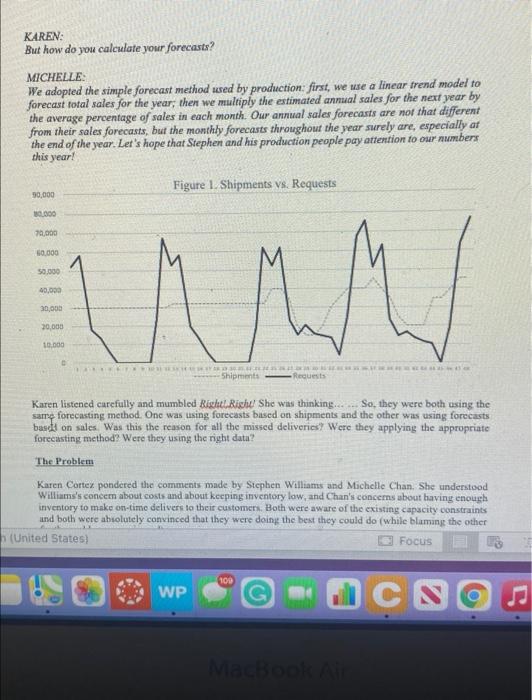
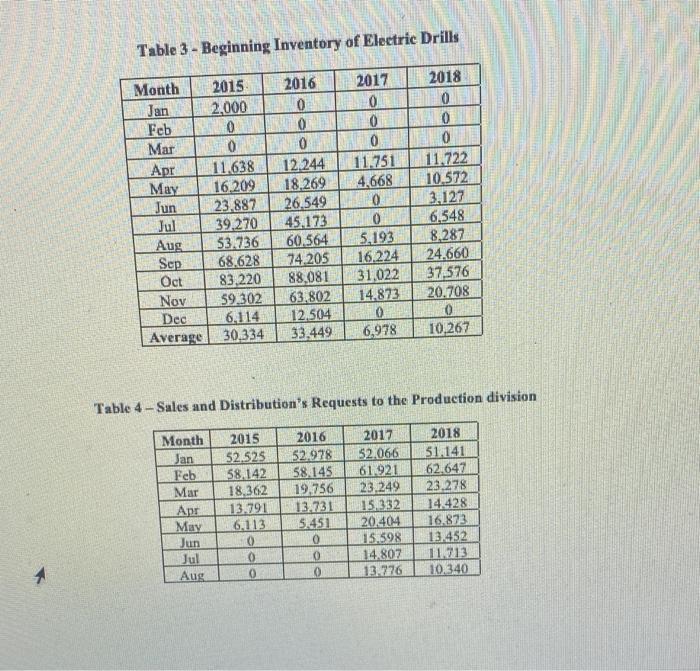
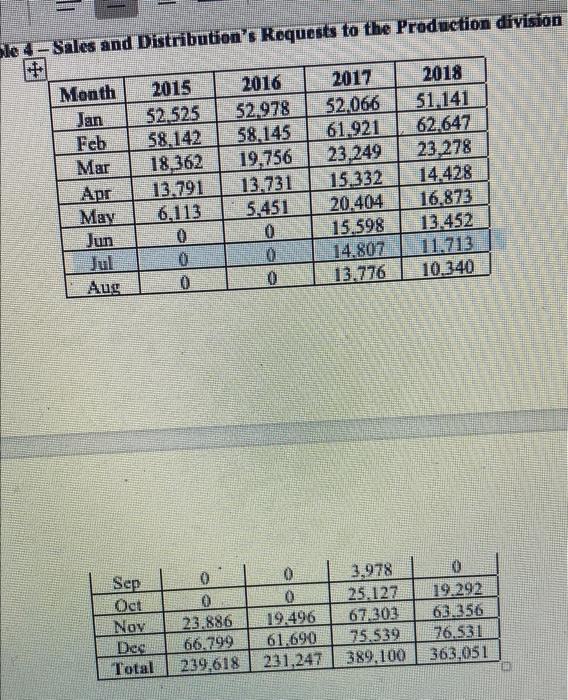
.1.7.1.8.1.9. 10. X C Chegg eReader Raritan Tool Company - Saved to my Mac C Raritan Tool Company (1) ut References View Mailings Review Tell me T A A Ever AL APA- Heading 1 Head TIU Sep Oct Nov Dec Total 0 0 3,978 0 0 0 25.127 19.292 23.886 19,496 67.303 63356 66.799 61.690 75,539 76,531 239,618 231,247 389,100 363,051 ASSIGNMENT 1. Comment on the forecasts prepared by the production manager Williams and by the sales department manager Chan. What were they doing wrong? 2. Use the available data on sales, inventory, and product requests to estimate the actual demand in the last four years. a) Copy tables 2 (Sales), 3 (Inventory) and 4 (Requests) onto a spreadsheet. Create a column with the numbers 1 through 48, titled t (time), and a column with the months January through December for four years, titled Month. Copy the data in each table into three columns, Sales, Inventory, Requests, each with 48 values to accommodate all 48 months. 04 Raritan Tool Company - Saved to Y MSC Raritan Tool Company (1) References Mailings Review View Tell me A 21 DA SE Ova Asliddl AB Hangt Raritan Tool Company The Too many people, pewien, cha nalait at a l Tamil es from epson Atletih we tool for the bought the DIY products were the market for me is on ve been made and the wood Come and be that we offer pled by any el diabete Sol y como es el de les for beide the These compare Toolimata piele nating highly postintele Here are try new presiden maryawal to decided din time do Now is beter dan Care Sairaal Shemale and urator Ilauty by.co sem hely www.davide The which kam Depot with The who from Chat - HD Wanted lian thaalu www. plamen Telp PIN WP CS % 5 & 7 6 8 9. STEPHEN Because we are an old company, planning is a little informal around here. Until two years ago, marketing determined the forecasts of electric drills for the following year month by month, and then they passed them along to me Quite frankly, their forecasts were so inflated that I automatically reduced them by 10 to 20% - it must be their big egos over there. KAREN: What?! Do you do cut their forecasts automatically? Without telling them? By 20 percent?! STEPHEN: Of course. We had such high inventories in the past that we usually ran out of space to store the extra production. We have to be careful because we enter into long-term purchasing contracts for steel and components, and it is expensive to have the inventory just sitting around. Plus, long production runs prevent is from producing a variety of other products on time, KAREN: But why are then customers complaining about late and missed deliveries? STEPHEN: Two years ago, we stopped producing a fixed quantity every month to be more responsive to the Laps" and "downs" of sales throughout the year. Now instead of using the forecasts provided by marketing. I use our own forecasts which are based on the actual shipments to the sales division (see Table 1). It is pretty simple: first we forecast the annual shipments with a linear trend model and then we calculate the monthly shipments based on the average percentage of each month in the previous four years. The system is working very well for us and the average inventory came down significantly KAREN Bur Marketing still complaints and says that they are late with customer orders, particularly at the end of the year Window Help + 6.171.8.19.70. X Chege Reader Raritan Tool Company - saved to my Mac Raritan Tool Company (1) out References Mailings Review Tell me View AL Aalbed A reading A A A.P.A. = = STEPHEN The food where ww/ with Tule 1 Dette Marketing SHIPMENTS M 2016 Mesy DOO, TO 0.000 DR Tube ME A DEK SYNO AM 129 M COS 2 NE SET AVTO MO LE NUM SS 100 350 11 COSTE NORGES NH BENESS INTRO ET Miche Wh wa Michelle Chi es 1 ho WP indow Help 28.1.9, 10X c Chogo Reader Raritan Tool Company Saved testy Mac Raritan Tool Company (1) Tell me Malings Review View References 21 Aalb Cebe AN we WA TASMUO SENONO.3232 418.000 Martin Pets legende general foto tante and , Maale derio MOCHIE ch www We www CALEN CHER TAR bil SALAH IN MERE M 2011 WP CS deliveries and last sales. The ULLSCCL Table 24Sales of Electric Drills + SALES - Four-Year History Month 2015 2016 2017 2018 Average Jan 32,000 32,000 40,000 45,000 37 250 9.8% Feb 30.000 32.000 40,000 40.000 35.500 Mar 18.362 19.756 23,249 23,278 21.161 5.6% 125.429 25.975 27.083 26.150 26.159 6.9% May 22.322 23.720 19.668 27.445 23 289 6.1% Jun 14.617 13.376 15.000 16,579 14,893 Jul 15.534 16,609 14,807 18.261 16303 4.3% Aug 15.108 181359 18.969 18.627 17766 417% Sep 15.408 18.124 20,202 22084 18955 5.0% Ost 53.91856279 56,149 56.868 55.804 14.7% Nov 83,188 83.298 54.873 65.208 1767 18.9% Dec 36,114 44.504 40.000 45.000 41.405 10.9% Total 362,000 384,000 370.000405.000||$80,250X100.0% Sales Forecast Month 2019 Jan 40,066 Feb 38,184 Mar 22.761 Apr 28.137 May 25.050 Jun 16,019 Jul 172525 Aug 19,109 Sep 201388 Oct 60,023 Nov 72193 Ded 44535 Total 409,000 Karen told Michelle that Stephen had changed his forecasting method and was doing his best to respond to big swings in sales. KAREN: But then, how do you explain that stock-outs have mereased? How do you do your monthly forecasts? MICHELLE Every month we start with our beginning wventory and place a production request if our forecasts exceed the amount in inventory we have in some months we make several urgent requests to the production division throughout the month to meet our customers anders. However, due to capacity constraints - or their stubbornness - the shipments we receive from production never match our requests (see Figure 1). *** KAREN: But how do you calculate your forecasts? MICHELLE We adopted the simple forecast method used by production: first, we use a linear trend model to forecast total sales for the year, then we multiply the estimated annual sales for the next year by the average percentage of sales in each month. Our annual sales forecasts are not that different from their sales forecasts, but the monthly forecasts throughout the year surely are, especially ar the end of the year. Let's hope that Stephen and his production people pay attention to our numbers this year! Figure 1. Shipments vs. Requests 30.000 10.000 (70,000 50.000 50.000 40,000 30,000 30.000 10.000 1 Shipments Requests Karen listened carefully and mumbled Right Right She was thinking... So, they were both using the sarre forecasting method. Onc was using forecasts based on shipments and the other was using forecasts based on sules. Was this the reason for all the missed deliveries? Were they applying the appropriate forecasting method? Were they using the right data? The Problem Karen Cortex pondered the comments made by Stephen Williams and Michelle Chan. She understood Williams's concern about costs and about keeping inventory low, and Chan's concerns about having enough inventory to make on-time delivers to their customers. Both were aware of the existing capacity constraints and both were absolutely convinced that they were doing the best they could do (while blaming the other h (United States) Focus 100 WP al CS The Problem Karen Cortez pondered the comments made by Stephen Williams and Michelle Chan. She understood Williams's concern about costs and about keeping inventory low, and Chan's concerns about having enough inventory to make on-time delivers to their customers. Both were aware of the existing capacity constraints and both were absolutely convinced that they were doing the best they could do (while blaming the other for the problems experienced). Yet, and as president Carole Smith had warned her, Karen felt that things seemed to be getting worse rather than better. In the year when the production department changed its strategy to be more responsive to sales, stock-outs shot up through the roof and sales took a dive. Yes, the average inventory was dramatically reduced in Year 3 but now it seemed it was creeping buck up again. Sales Months with Average stock-outs Inventory 30,334 3 33.449 2015 2016 362,000 384,000 2017 2018 370,000 405.000 6,978 10.267 4 While both production and sales managers were arguing about the distribution of sales throughout the year. they were not aware of the serious forecasting mistakes they were making. Some were minor mistakes and quitt evident. However, how could they have missed that shipments and sales may not reflect demand accurately?! She compared sales and shipments and noticed that every year sules vastly exceeded shipments in the winter months (see Figure 2). In the last two years shipments followed sales more closely as production was trying to be more responsive to monthly variations of demand. However, how could both Michelle and Stephen be sure that they had estimated demand accurately? How many sales had been lost because of using the wrong diata in their forecasts?!!! Window Help + 17.1.8.1.9. 10. X C Chege Reader Raritan Tool Company Seved to my Me Raritan Tool Company (1) at References Mailings Review View Tell me A A9 APA , Aalbod All 1010 tasala they werden vity shtes She wydd la te wees Matiils haw be MA w 1 D WP CS DOD * $ 4 5 6 7 8 CUSTOMERS Sales ---Sales forecast? Demand forecast? 4 Demand SALES DIVISION Inventory Requests Shipments + Sales forecast? PRODUCTION DIVISION Table 3 - Beginning Inventory of Eleetric Drills 2017 0 0 Month 2015 Jan 2,000 Feb 0 Mar 0 Apr 11,638 May 16.209 Jun 23.882 Jul 39,270 Aug 53,736 Sep 68.628 Oct 83,220 Nov 59.302 Dec 6,114 Average 30,334 2016 0 0 0 12.244 18.269 26,549 45,173 60.564 74,205 88,081 63,802 12.504 33,449 11.751 4,668 0 0 5.193 16,224 31.022 14.873 0 6,978 2018 0 0 0 11.722 10.572 3,127 6,548 8.287 24.660 37,576 20.708 10,267 Table 4-Sales and Distribution's Requests to the Production division Month Jan Feb Mar Apr May Jun Jul Aug 2015 52.525 58.142 18,362 13.791 6.113 0 0 0 2016 52.978 58.145 19,756 13.731 5.451 0 0 0 2017 52.066 61921 23,249 15,332 20,404 15.598 14,807 13.776 2018 51.141 62.6472 23.278 14.428 16,873 13,452 11.713 10.340 A Ole 4-Sales and Distribution's Requests to the Production division Month Jan Feb Mar Apr May Jun Jul Aug 2015 52525 58,142 18,362 13.791 6.113 0 0 0 2016 52.978 58.145 19,756 13.731 5,451 0 0 0 2017 52.066 61,921 23 249 15.332 20,404 15,598 14.807 13.776 2018 51,141 62.647 23,278 14.428 16,873 13.452 11.713 10.340 Sep Oct Nov Dee Total 0 0 23.886 66.799 239.618 0 0 19,496 61.690 231,247 3,978 25.127 67.303 75.539 389.100 19.292 63356 26.531 363,051 .1.7.1.8.1.9. 10. X C Chegg eReader Raritan Tool Company - Saved to my Mac C Raritan Tool Company (1) ut References View Mailings Review Tell me T A A Ever AL APA- Heading 1 Head TIU Sep Oct Nov Dec Total 0 0 3,978 0 0 0 25.127 19.292 23.886 19,496 67.303 63356 66.799 61.690 75,539 76,531 239,618 231,247 389,100 363,051 ASSIGNMENT 1. Comment on the forecasts prepared by the production manager Williams and by the sales department manager Chan. What were they doing wrong? 2. Use the available data on sales, inventory, and product requests to estimate the actual demand in the last four years. a) Copy tables 2 (Sales), 3 (Inventory) and 4 (Requests) onto a spreadsheet. Create a column with the numbers 1 through 48, titled t (time), and a column with the months January through December for four years, titled Month. Copy the data in each table into three columns, Sales, Inventory, Requests, each with 48 values to accommodate all 48 months. 04 Raritan Tool Company - Saved to Y MSC Raritan Tool Company (1) References Mailings Review View Tell me A 21 DA SE Ova Asliddl AB Hangt Raritan Tool Company The Too many people, pewien, cha nalait at a l Tamil es from epson Atletih we tool for the bought the DIY products were the market for me is on ve been made and the wood Come and be that we offer pled by any el diabete Sol y como es el de les for beide the These compare Toolimata piele nating highly postintele Here are try new presiden maryawal to decided din time do Now is beter dan Care Sairaal Shemale and urator Ilauty by.co sem hely www.davide The which kam Depot with The who from Chat - HD Wanted lian thaalu www. plamen Telp PIN WP CS % 5 & 7 6 8 9. STEPHEN Because we are an old company, planning is a little informal around here. Until two years ago, marketing determined the forecasts of electric drills for the following year month by month, and then they passed them along to me Quite frankly, their forecasts were so inflated that I automatically reduced them by 10 to 20% - it must be their big egos over there. KAREN: What?! Do you do cut their forecasts automatically? Without telling them? By 20 percent?! STEPHEN: Of course. We had such high inventories in the past that we usually ran out of space to store the extra production. We have to be careful because we enter into long-term purchasing contracts for steel and components, and it is expensive to have the inventory just sitting around. Plus, long production runs prevent is from producing a variety of other products on time, KAREN: But why are then customers complaining about late and missed deliveries? STEPHEN: Two years ago, we stopped producing a fixed quantity every month to be more responsive to the Laps" and "downs" of sales throughout the year. Now instead of using the forecasts provided by marketing. I use our own forecasts which are based on the actual shipments to the sales division (see Table 1). It is pretty simple: first we forecast the annual shipments with a linear trend model and then we calculate the monthly shipments based on the average percentage of each month in the previous four years. The system is working very well for us and the average inventory came down significantly KAREN Bur Marketing still complaints and says that they are late with customer orders, particularly at the end of the year Window Help + 6.171.8.19.70. X Chege Reader Raritan Tool Company - saved to my Mac Raritan Tool Company (1) out References Mailings Review Tell me View AL Aalbed A reading A A A.P.A. = = STEPHEN The food where ww/ with Tule 1 Dette Marketing SHIPMENTS M 2016 Mesy DOO, TO 0.000 DR Tube ME A DEK SYNO AM 129 M COS 2 NE SET AVTO MO LE NUM SS 100 350 11 COSTE NORGES NH BENESS INTRO ET Miche Wh wa Michelle Chi es 1 ho WP indow Help 28.1.9, 10X c Chogo Reader Raritan Tool Company Saved testy Mac Raritan Tool Company (1) Tell me Malings Review View References 21 Aalb Cebe AN we WA TASMUO SENONO.3232 418.000 Martin Pets legende general foto tante and , Maale derio MOCHIE ch www We www CALEN CHER TAR bil SALAH IN MERE M 2011 WP CS deliveries and last sales. The ULLSCCL Table 24Sales of Electric Drills + SALES - Four-Year History Month 2015 2016 2017 2018 Average Jan 32,000 32,000 40,000 45,000 37 250 9.8% Feb 30.000 32.000 40,000 40.000 35.500 Mar 18.362 19.756 23,249 23,278 21.161 5.6% 125.429 25.975 27.083 26.150 26.159 6.9% May 22.322 23.720 19.668 27.445 23 289 6.1% Jun 14.617 13.376 15.000 16,579 14,893 Jul 15.534 16,609 14,807 18.261 16303 4.3% Aug 15.108 181359 18.969 18.627 17766 417% Sep 15.408 18.124 20,202 22084 18955 5.0% Ost 53.91856279 56,149 56.868 55.804 14.7% Nov 83,188 83.298 54.873 65.208 1767 18.9% Dec 36,114 44.504 40.000 45.000 41.405 10.9% Total 362,000 384,000 370.000405.000||$80,250X100.0% Sales Forecast Month 2019 Jan 40,066 Feb 38,184 Mar 22.761 Apr 28.137 May 25.050 Jun 16,019 Jul 172525 Aug 19,109 Sep 201388 Oct 60,023 Nov 72193 Ded 44535 Total 409,000 Karen told Michelle that Stephen had changed his forecasting method and was doing his best to respond to big swings in sales. KAREN: But then, how do you explain that stock-outs have mereased? How do you do your monthly forecasts? MICHELLE Every month we start with our beginning wventory and place a production request if our forecasts exceed the amount in inventory we have in some months we make several urgent requests to the production division throughout the month to meet our customers anders. However, due to capacity constraints - or their stubbornness - the shipments we receive from production never match our requests (see Figure 1). *** KAREN: But how do you calculate your forecasts? MICHELLE We adopted the simple forecast method used by production: first, we use a linear trend model to forecast total sales for the year, then we multiply the estimated annual sales for the next year by the average percentage of sales in each month. Our annual sales forecasts are not that different from their sales forecasts, but the monthly forecasts throughout the year surely are, especially ar the end of the year. Let's hope that Stephen and his production people pay attention to our numbers this year! Figure 1. Shipments vs. Requests 30.000 10.000 (70,000 50.000 50.000 40,000 30,000 30.000 10.000 1 Shipments Requests Karen listened carefully and mumbled Right Right She was thinking... So, they were both using the sarre forecasting method. Onc was using forecasts based on shipments and the other was using forecasts based on sules. Was this the reason for all the missed deliveries? Were they applying the appropriate forecasting method? Were they using the right data? The Problem Karen Cortex pondered the comments made by Stephen Williams and Michelle Chan. She understood Williams's concern about costs and about keeping inventory low, and Chan's concerns about having enough inventory to make on-time delivers to their customers. Both were aware of the existing capacity constraints and both were absolutely convinced that they were doing the best they could do (while blaming the other h (United States) Focus 100 WP al CS The Problem Karen Cortez pondered the comments made by Stephen Williams and Michelle Chan. She understood Williams's concern about costs and about keeping inventory low, and Chan's concerns about having enough inventory to make on-time delivers to their customers. Both were aware of the existing capacity constraints and both were absolutely convinced that they were doing the best they could do (while blaming the other for the problems experienced). Yet, and as president Carole Smith had warned her, Karen felt that things seemed to be getting worse rather than better. In the year when the production department changed its strategy to be more responsive to sales, stock-outs shot up through the roof and sales took a dive. Yes, the average inventory was dramatically reduced in Year 3 but now it seemed it was creeping buck up again. Sales Months with Average stock-outs Inventory 30,334 3 33.449 2015 2016 362,000 384,000 2017 2018 370,000 405.000 6,978 10.267 4 While both production and sales managers were arguing about the distribution of sales throughout the year. they were not aware of the serious forecasting mistakes they were making. Some were minor mistakes and quitt evident. However, how could they have missed that shipments and sales may not reflect demand accurately?! She compared sales and shipments and noticed that every year sules vastly exceeded shipments in the winter months (see Figure 2). In the last two years shipments followed sales more closely as production was trying to be more responsive to monthly variations of demand. However, how could both Michelle and Stephen be sure that they had estimated demand accurately? How many sales had been lost because of using the wrong diata in their forecasts?!!! Window Help + 17.1.8.1.9. 10. X C Chege Reader Raritan Tool Company Seved to my Me Raritan Tool Company (1) at References Mailings Review View Tell me A A9 APA , Aalbod All 1010 tasala they werden vity shtes She wydd la te wees Matiils haw be MA w 1 D WP CS DOD * $ 4 5 6 7 8 CUSTOMERS Sales ---Sales forecast? Demand forecast? 4 Demand SALES DIVISION Inventory Requests Shipments + Sales forecast? PRODUCTION DIVISION Table 3 - Beginning Inventory of Eleetric Drills 2017 0 0 Month 2015 Jan 2,000 Feb 0 Mar 0 Apr 11,638 May 16.209 Jun 23.882 Jul 39,270 Aug 53,736 Sep 68.628 Oct 83,220 Nov 59.302 Dec 6,114 Average 30,334 2016 0 0 0 12.244 18.269 26,549 45,173 60.564 74,205 88,081 63,802 12.504 33,449 11.751 4,668 0 0 5.193 16,224 31.022 14.873 0 6,978 2018 0 0 0 11.722 10.572 3,127 6,548 8.287 24.660 37,576 20.708 10,267 Table 4-Sales and Distribution's Requests to the Production division Month Jan Feb Mar Apr May Jun Jul Aug 2015 52.525 58.142 18,362 13.791 6.113 0 0 0 2016 52.978 58.145 19,756 13.731 5.451 0 0 0 2017 52.066 61921 23,249 15,332 20,404 15.598 14,807 13.776 2018 51.141 62.6472 23.278 14.428 16,873 13,452 11.713 10.340 A Ole 4-Sales and Distribution's Requests to the Production division Month Jan Feb Mar Apr May Jun Jul Aug 2015 52525 58,142 18,362 13.791 6.113 0 0 0 2016 52.978 58.145 19,756 13.731 5,451 0 0 0 2017 52.066 61,921 23 249 15.332 20,404 15,598 14.807 13.776 2018 51,141 62.647 23,278 14.428 16,873 13.452 11.713 10.340 Sep Oct Nov Dee Total 0 0 23.886 66.799 239.618 0 0 19,496 61.690 231,247 3,978 25.127 67.303 75.539 389.100 19.292 63356 26.531 363,051