

Question: 1. Answer choices- Chebyshev's Theorem2. Answer choices- approximately, at least, at most 3. Answer choices- approximately, at least, at most Use the histogram below to
1. Answer choices- Chebyshev's Theorem2. Answer choices- approximately, at least, at most 3. Answer choices- approximately, at least, at most
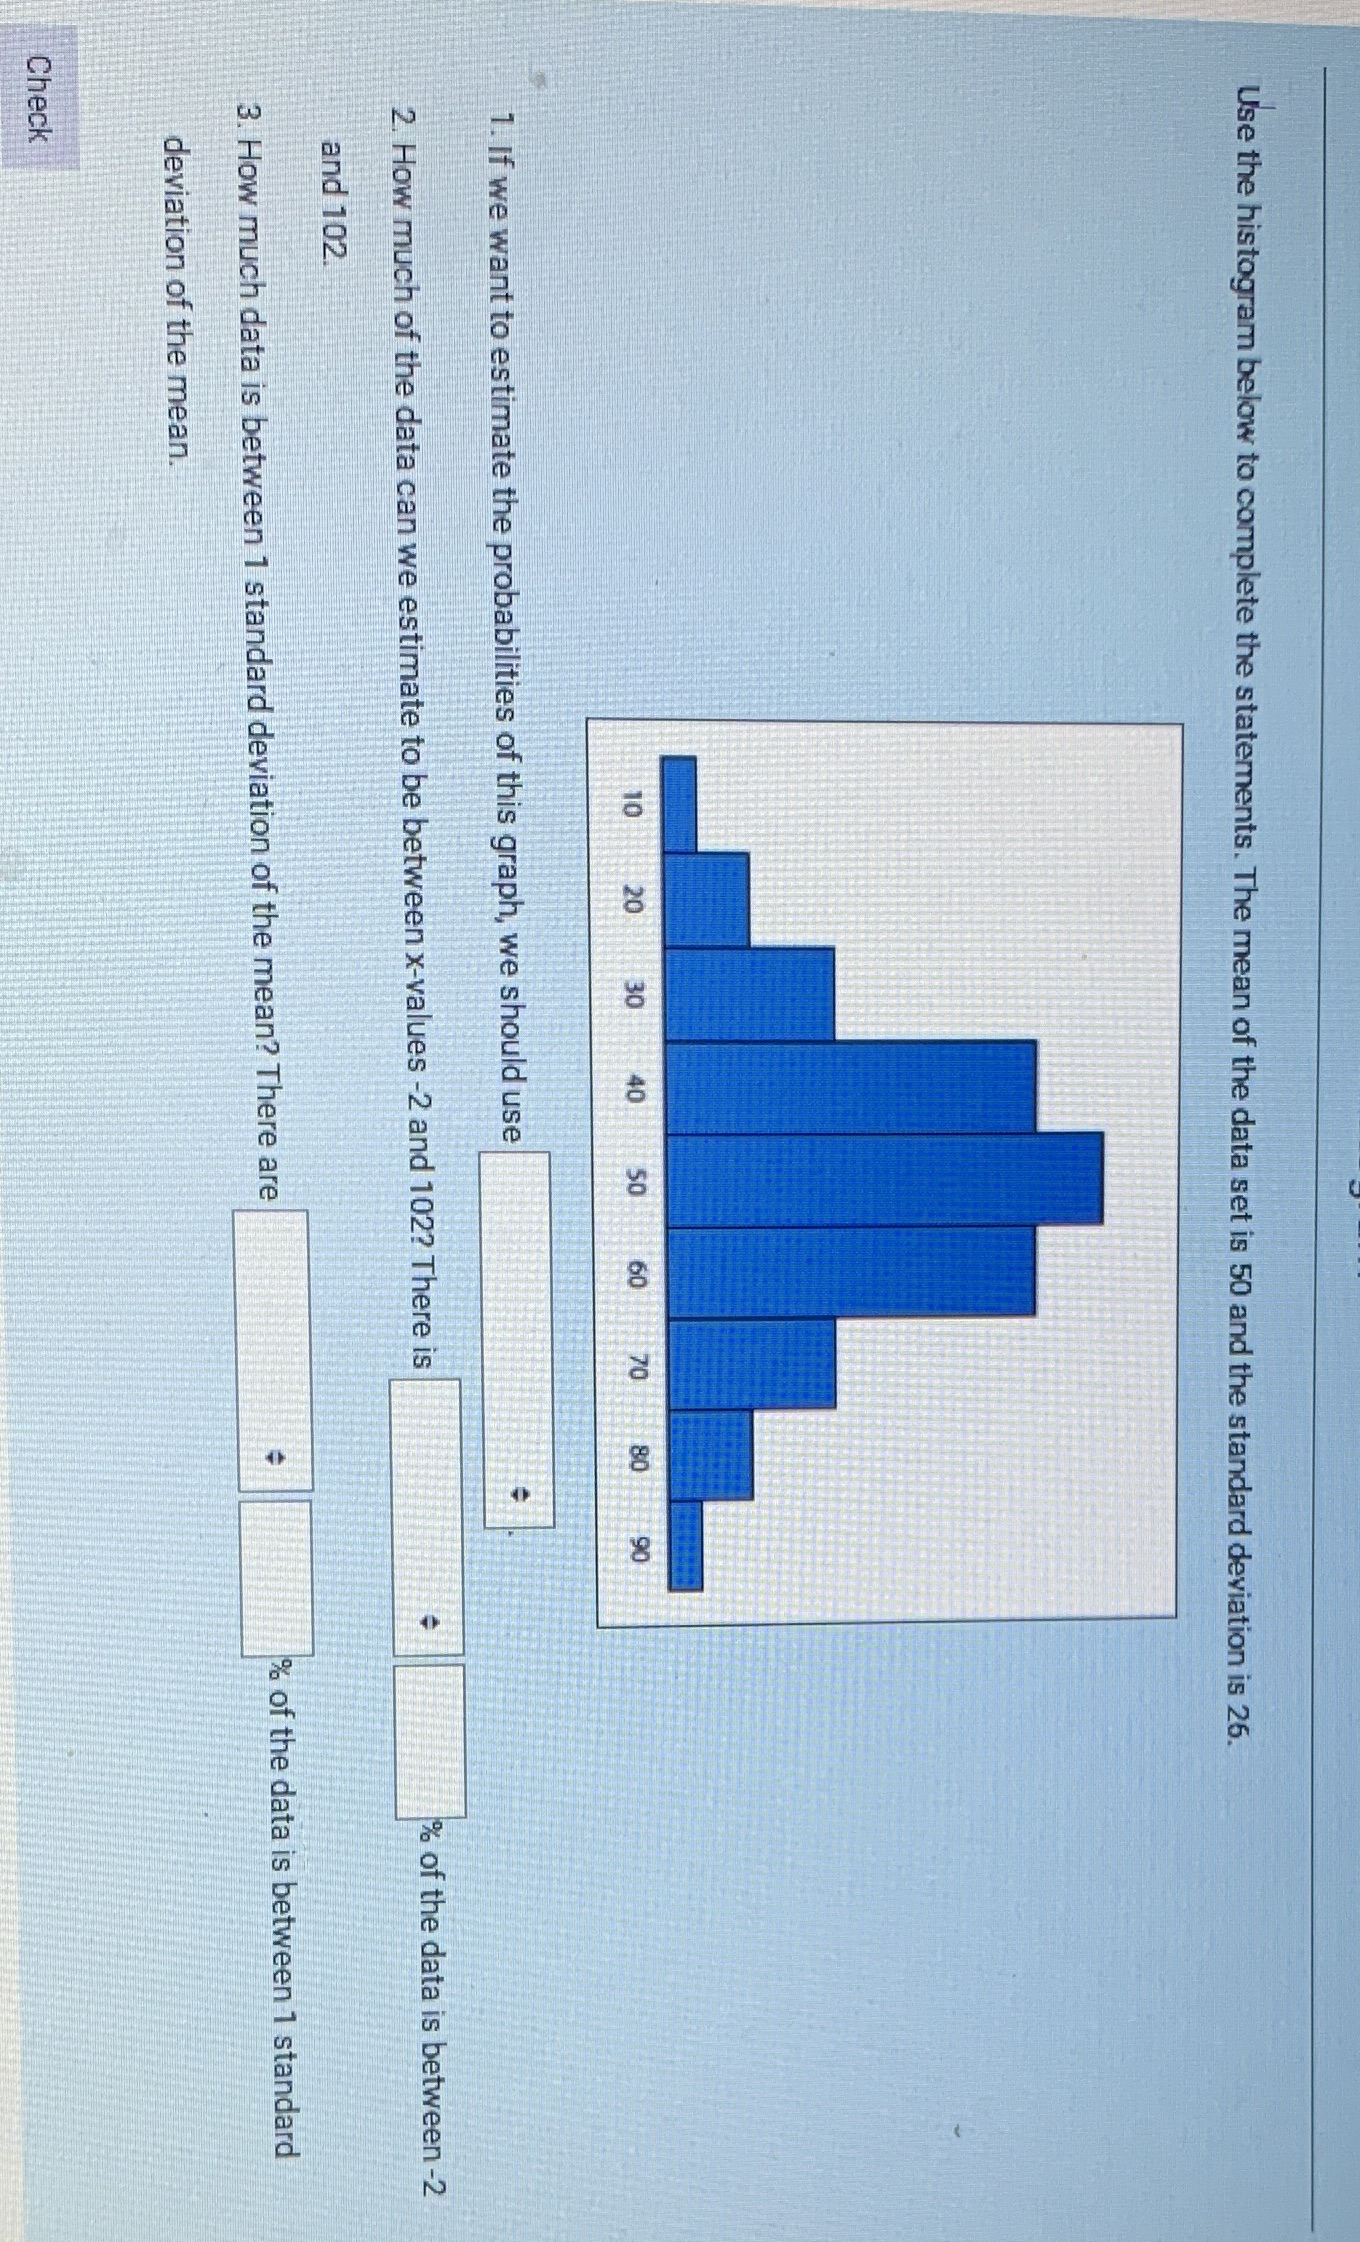
Use the histogram below to complete the statements. The mean of the data set is 50 and the standard deviation is 26. 20 30 40 50 60 70 80 90 1. If we want to estimate the probabilities of this graph, we should use 2. How much of the data can we estimate to be between x-values -2 and 102? There is % of the data is between -2 and 102. 3. How much data is between 1 standard deviation of the mean? There are % of the data is between 1 standard deviation of the mean. Check
Step by Step Solution
There are 3 Steps involved in it
1 Expert Approved Answer
Step: 1 Unlock

Question Has Been Solved by an Expert!
Get step-by-step solutions from verified subject matter experts
Step: 2 Unlock
Step: 3 Unlock