

Question: 1 Assignment 6 2 Question 6 4 an toc an toc Date 11/30/16 10/31/16 9/28/16 8/31/16 7/29/16 6/30/16 5/31/16 4/29/16 3/31/16 2/25/16 1/31/16 12/31/15 11/30/15
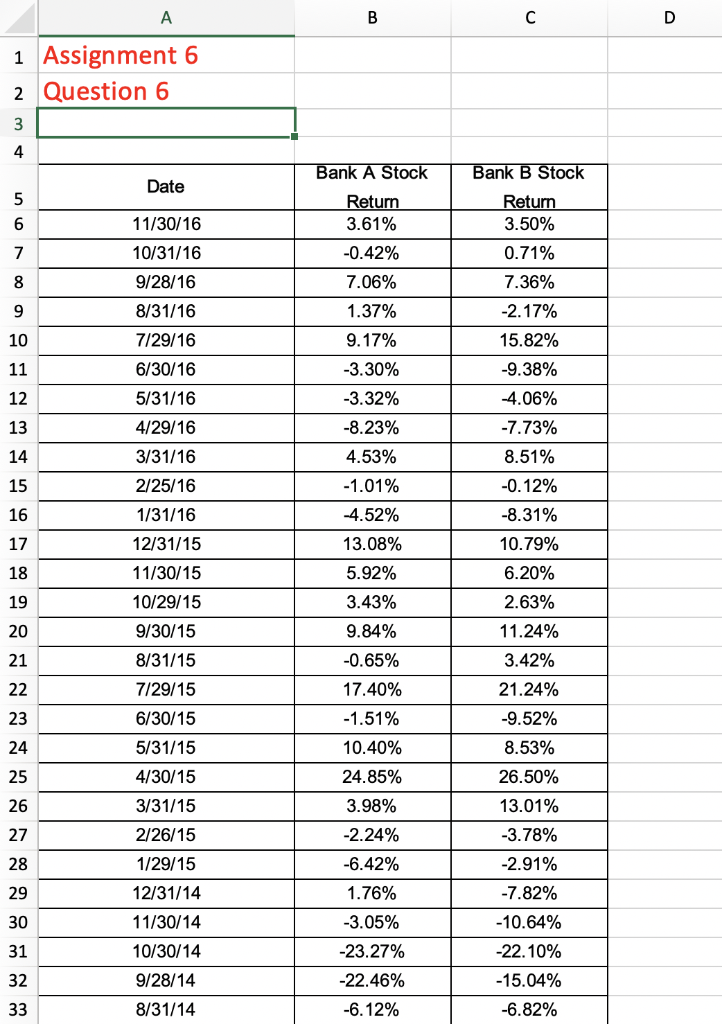
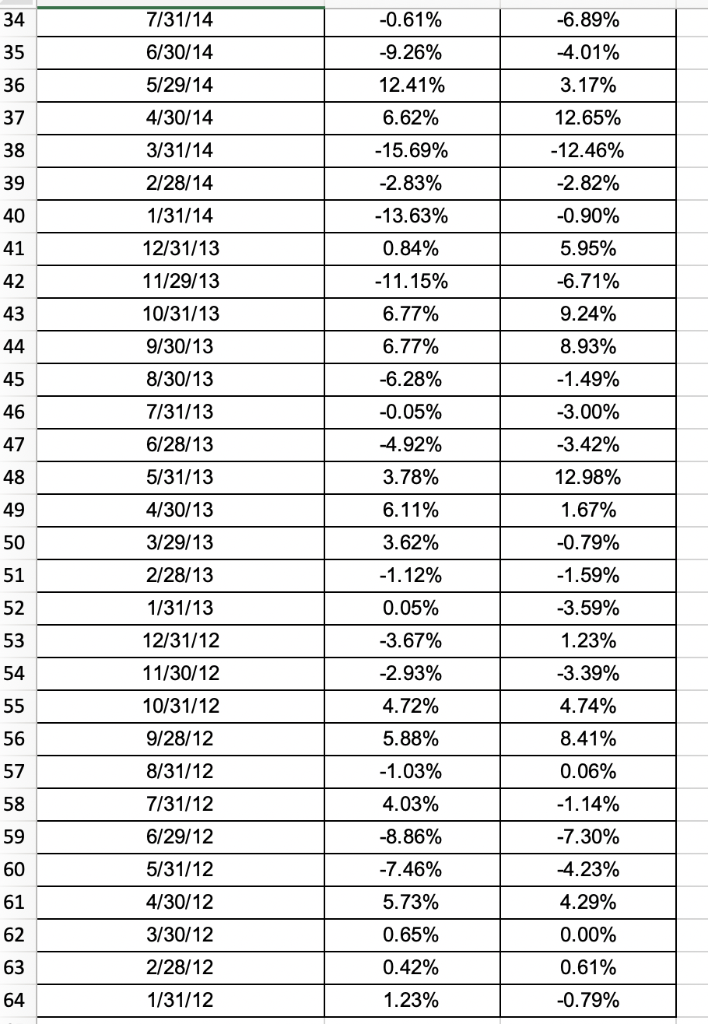
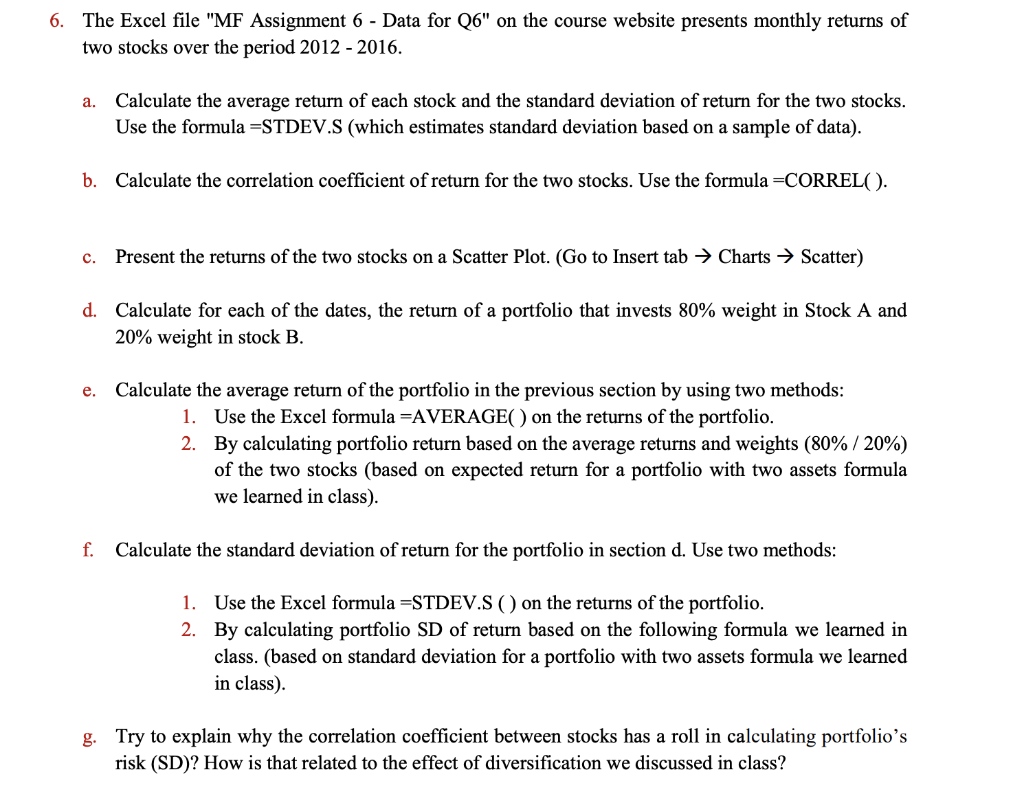
1 Assignment 6 2 Question 6 4 an toc an toc Date 11/30/16 10/31/16 9/28/16 8/31/16 7/29/16 6/30/16 5/31/16 4/29/16 3/31/16 2/25/16 1/31/16 12/31/15 11/30/15 10/29/15 9/30/15 8/31/15 7/29/15 6/30/15 5/31/15 4/30/15 3/31/15 2/26/15 1/29/15 12/31/14 11/30/14 10/30/14 9/28/14 8/31/14 Returm etum 3.61% -0.42% 00% 1.37% 9.17% -3.30% -3.32% -8.23% 453% -1.01% -4.52% 13.08% 6 0.71% 8 -2.1 7% 15. 82% -9.38% 4.06% -7 73% 8.51% -0.1 2% -8.31% 10.79% 620% 2.63% 11 .24% 3.42% 21.24% -9.52% 8.53% 26.50% 13.01% -378% -2.91% 13 15 17 3.43% 9.84% -0.65% 17.40% -1.51% 10.40% 24.85% 3.98% -2.24% -6.42% 76% -3.05% -23.27% 22.46% -6.1 2% 20 23 24 25 26 27 29 30 -10.64% 22. 10% -15.04% -6.82% 16-20 0 5 0 0 43 9028 2 0 0 0 4164039019 .7-401-32 5 322 1-6-1 2 122 71610 0 -5-7-3 3523 08-4. 7642 8 2 1 2 1-1 1 1-1 1 3323323 323 333233223 / /233233323 4567890123 3333334444 56789 1 2 3 4 5 6 7 8 9 0 1 2 3 4444455555555556666 The Excel file "MF Assignment 6 - Data for Q6" on the course website presents monthly returns of two stocks over the period 2012 - 2016. 6. Calculate the average return of each stock and the standard deviation of return for the two stocks. Use the formula-STDEV.S (which estimates standard deviation based on a sample of data) a. b. Calculate the correlation coefficient of return for the two stocks. Use the formula-CORRELC) c. Present the returns of the two stocks on a Scatter Plot. (Go to Insert tab Charts > Scatter) Calculate for each of the dates, the return of a portfolio that invests 80% weight in Stock A and 20% weight in stock B. d. e. Calculate the average return of the portfolio in the previous section by using two methods: 1. Use the Excel formula -AVERAGE) on the returns of the portfolio. 2. By calculating portfolio return based on the average returns and weights (80% / 20%) of the two stocks (based on expected return for a portfolio with two assets formula we learned in class). f. Calculate the standard deviation of return for the portfolio in section d. Use two methods: Use the Excel formula -STDEV.S () on the returns of the portfolio. By calculating portfolio SD of return based on the following formula we learned in class. (based on standard deviation for a portfolio with two assets formula we learned in class) 1. 2. g. Try to explain why the correlation coefficient between stocks has a rol in calculating portfolio's risk (SD)? How is that related to the effect of diversification we discussed in class? 1 Assignment 6 2 Question 6 4 an toc an toc Date 11/30/16 10/31/16 9/28/16 8/31/16 7/29/16 6/30/16 5/31/16 4/29/16 3/31/16 2/25/16 1/31/16 12/31/15 11/30/15 10/29/15 9/30/15 8/31/15 7/29/15 6/30/15 5/31/15 4/30/15 3/31/15 2/26/15 1/29/15 12/31/14 11/30/14 10/30/14 9/28/14 8/31/14 Returm etum 3.61% -0.42% 00% 1.37% 9.17% -3.30% -3.32% -8.23% 453% -1.01% -4.52% 13.08% 6 0.71% 8 -2.1 7% 15. 82% -9.38% 4.06% -7 73% 8.51% -0.1 2% -8.31% 10.79% 620% 2.63% 11 .24% 3.42% 21.24% -9.52% 8.53% 26.50% 13.01% -378% -2.91% 13 15 17 3.43% 9.84% -0.65% 17.40% -1.51% 10.40% 24.85% 3.98% -2.24% -6.42% 76% -3.05% -23.27% 22.46% -6.1 2% 20 23 24 25 26 27 29 30 -10.64% 22. 10% -15.04% -6.82% 16-20 0 5 0 0 43 9028 2 0 0 0 4164039019 .7-401-32 5 322 1-6-1 2 122 71610 0 -5-7-3 3523 08-4. 7642 8 2 1 2 1-1 1 1-1 1 3323323 323 333233223 / /233233323 4567890123 3333334444 56789 1 2 3 4 5 6 7 8 9 0 1 2 3 4444455555555556666 The Excel file "MF Assignment 6 - Data for Q6" on the course website presents monthly returns of two stocks over the period 2012 - 2016. 6. Calculate the average return of each stock and the standard deviation of return for the two stocks. Use the formula-STDEV.S (which estimates standard deviation based on a sample of data) a. b. Calculate the correlation coefficient of return for the two stocks. Use the formula-CORRELC) c. Present the returns of the two stocks on a Scatter Plot. (Go to Insert tab Charts > Scatter) Calculate for each of the dates, the return of a portfolio that invests 80% weight in Stock A and 20% weight in stock B. d. e. Calculate the average return of the portfolio in the previous section by using two methods: 1. Use the Excel formula -AVERAGE) on the returns of the portfolio. 2. By calculating portfolio return based on the average returns and weights (80% / 20%) of the two stocks (based on expected return for a portfolio with two assets formula we learned in class). f. Calculate the standard deviation of return for the portfolio in section d. Use two methods: Use the Excel formula -STDEV.S () on the returns of the portfolio. By calculating portfolio SD of return based on the following formula we learned in class. (based on standard deviation for a portfolio with two assets formula we learned in class) 1. 2. g. Try to explain why the correlation coefficient between stocks has a rol in calculating portfolio's risk (SD)? How is that related to the effect of diversification we discussed in class
Step by Step Solution
There are 3 Steps involved in it

Get step-by-step solutions from verified subject matter experts