

Question: 1. Based on the below (attached) results, reflect on the state of WRSX as a company (after the 3 board meetings) and make 5 concrete
1. Based on the below (attached) results, reflect on the state of WRSX as a company (after the 3 board meetings) and make 5 concrete recommendations for the company moving forward.
- Other than backing up by data provided in the attached images, each of your concrete action plan needs to be explained and anchored on relevant business management theory/framework/model.
Note: The top priority action plan needs to be presented first and the least priority presented last.
These recommendations have to be specific, measurable, achievable/attainable (in the short or long-term), realistic and time-bound = S.M.A.R.T
BOARD MEETING 1
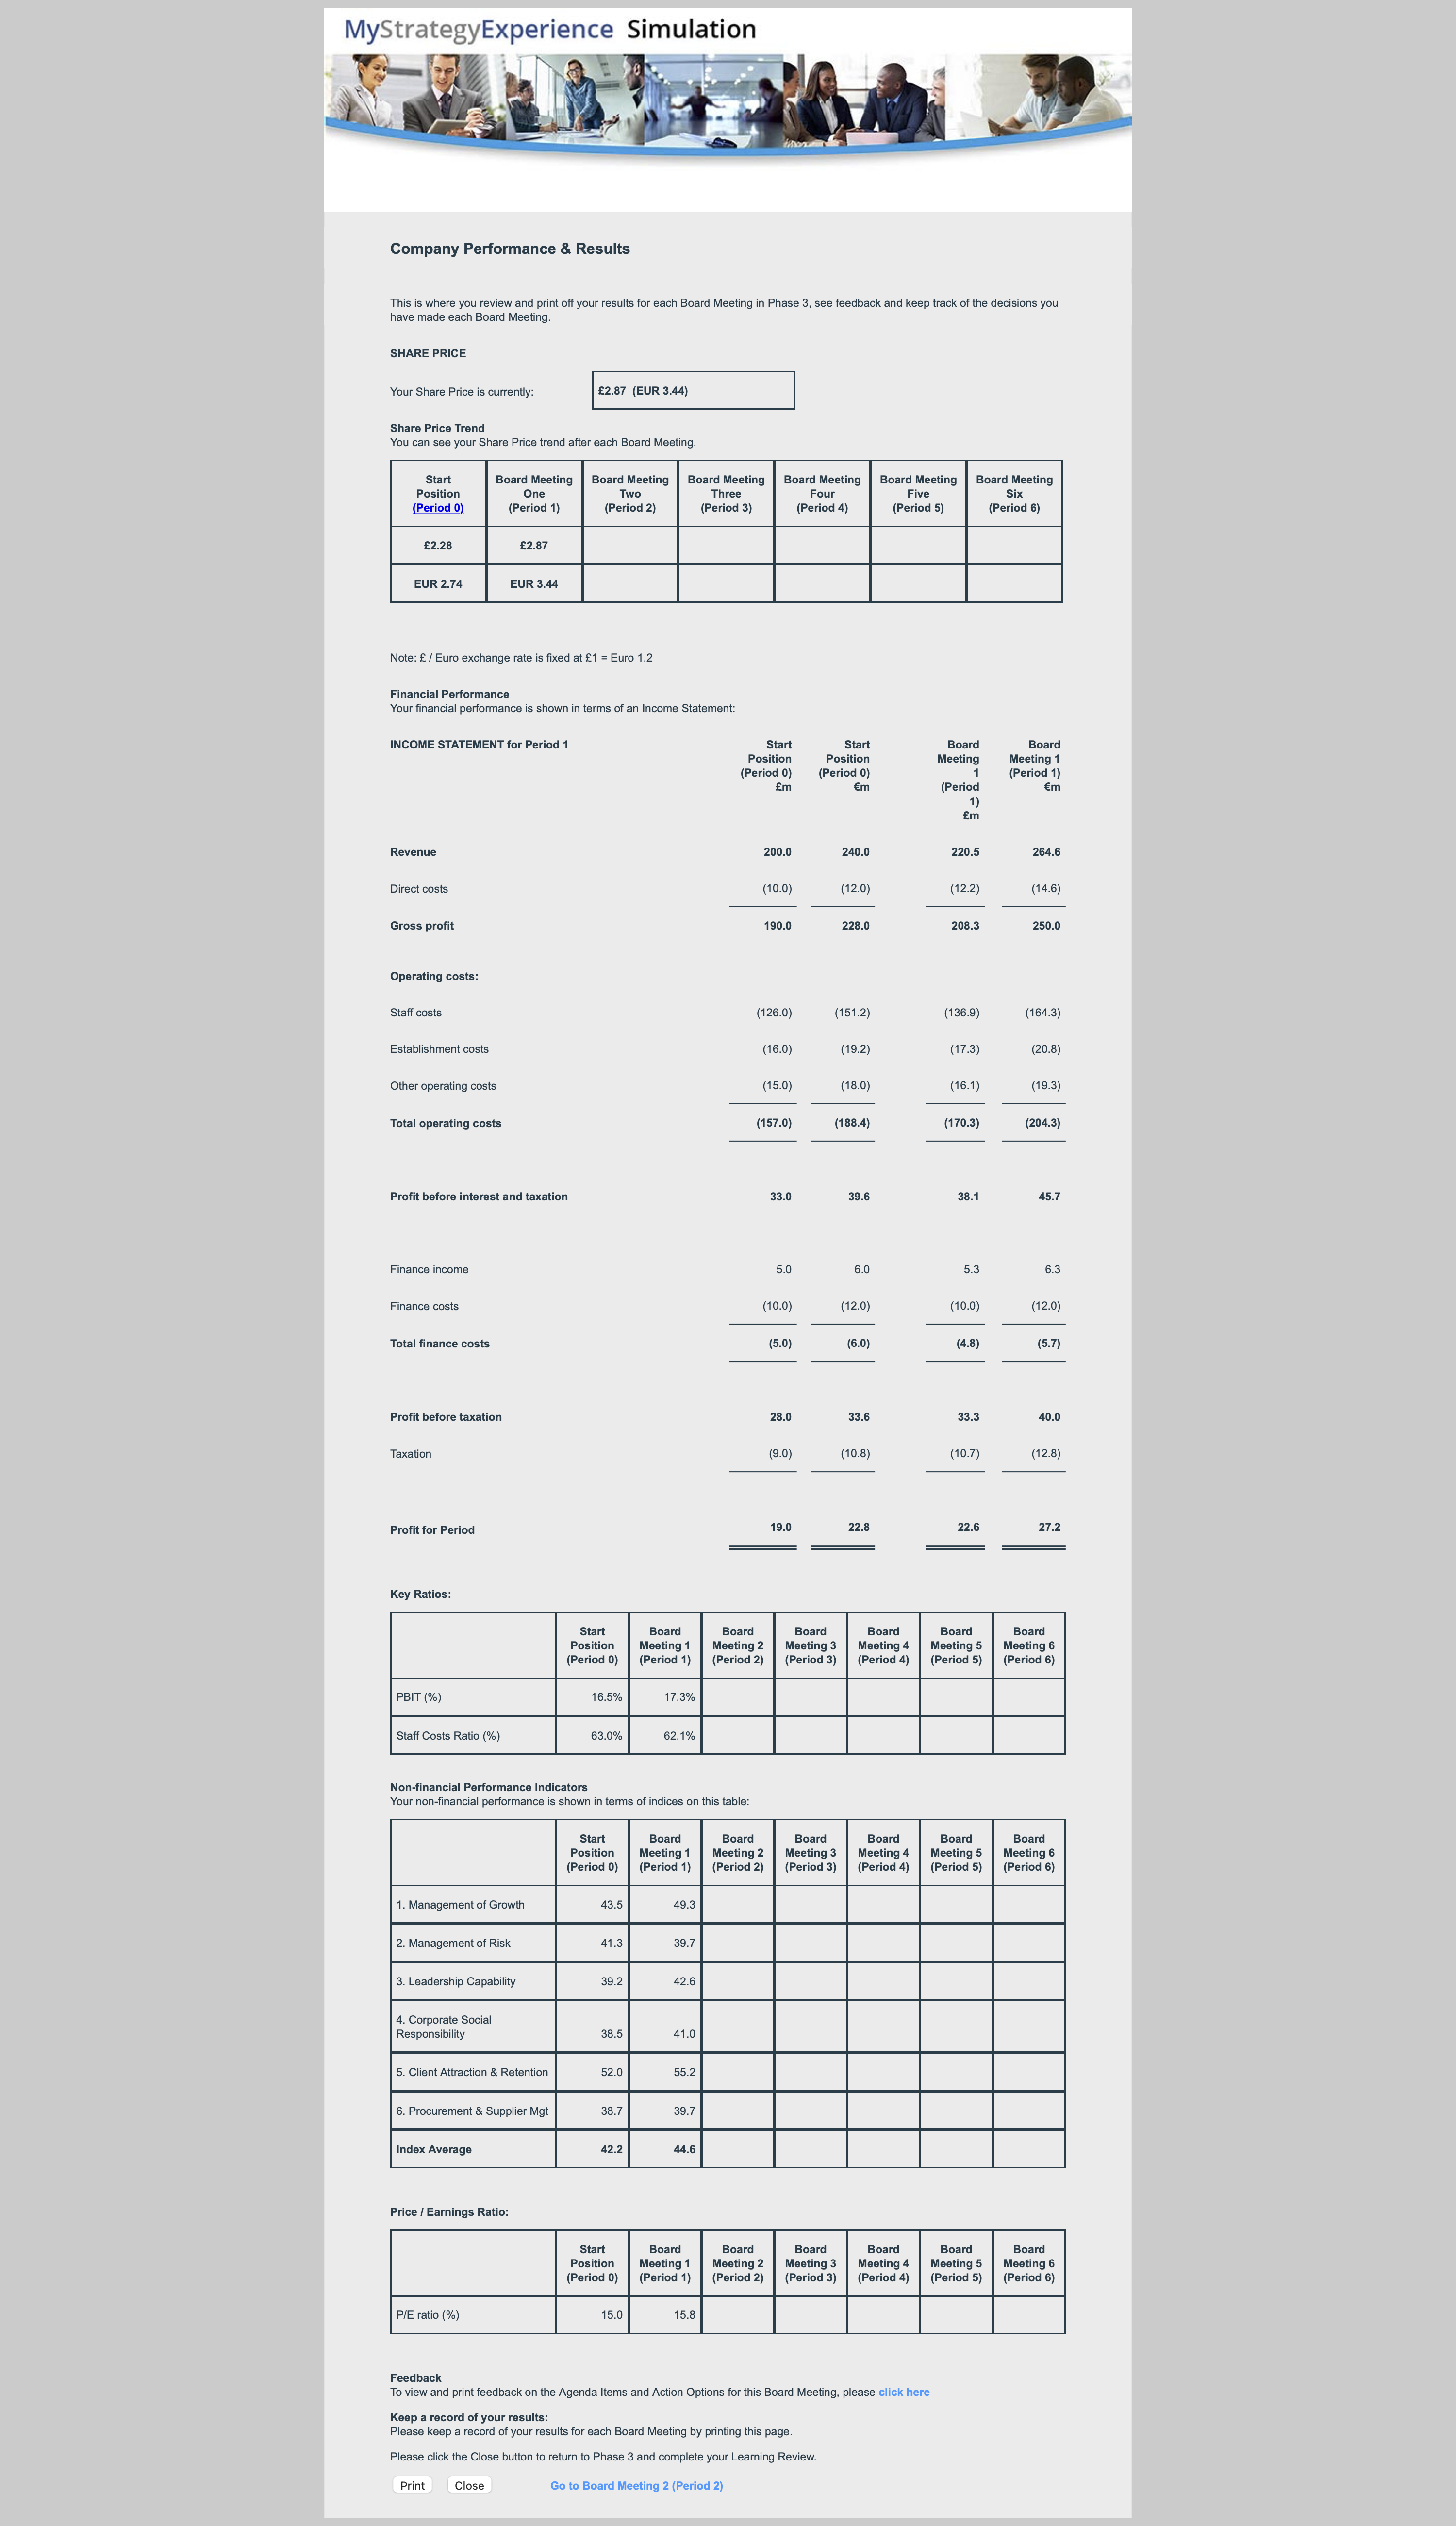
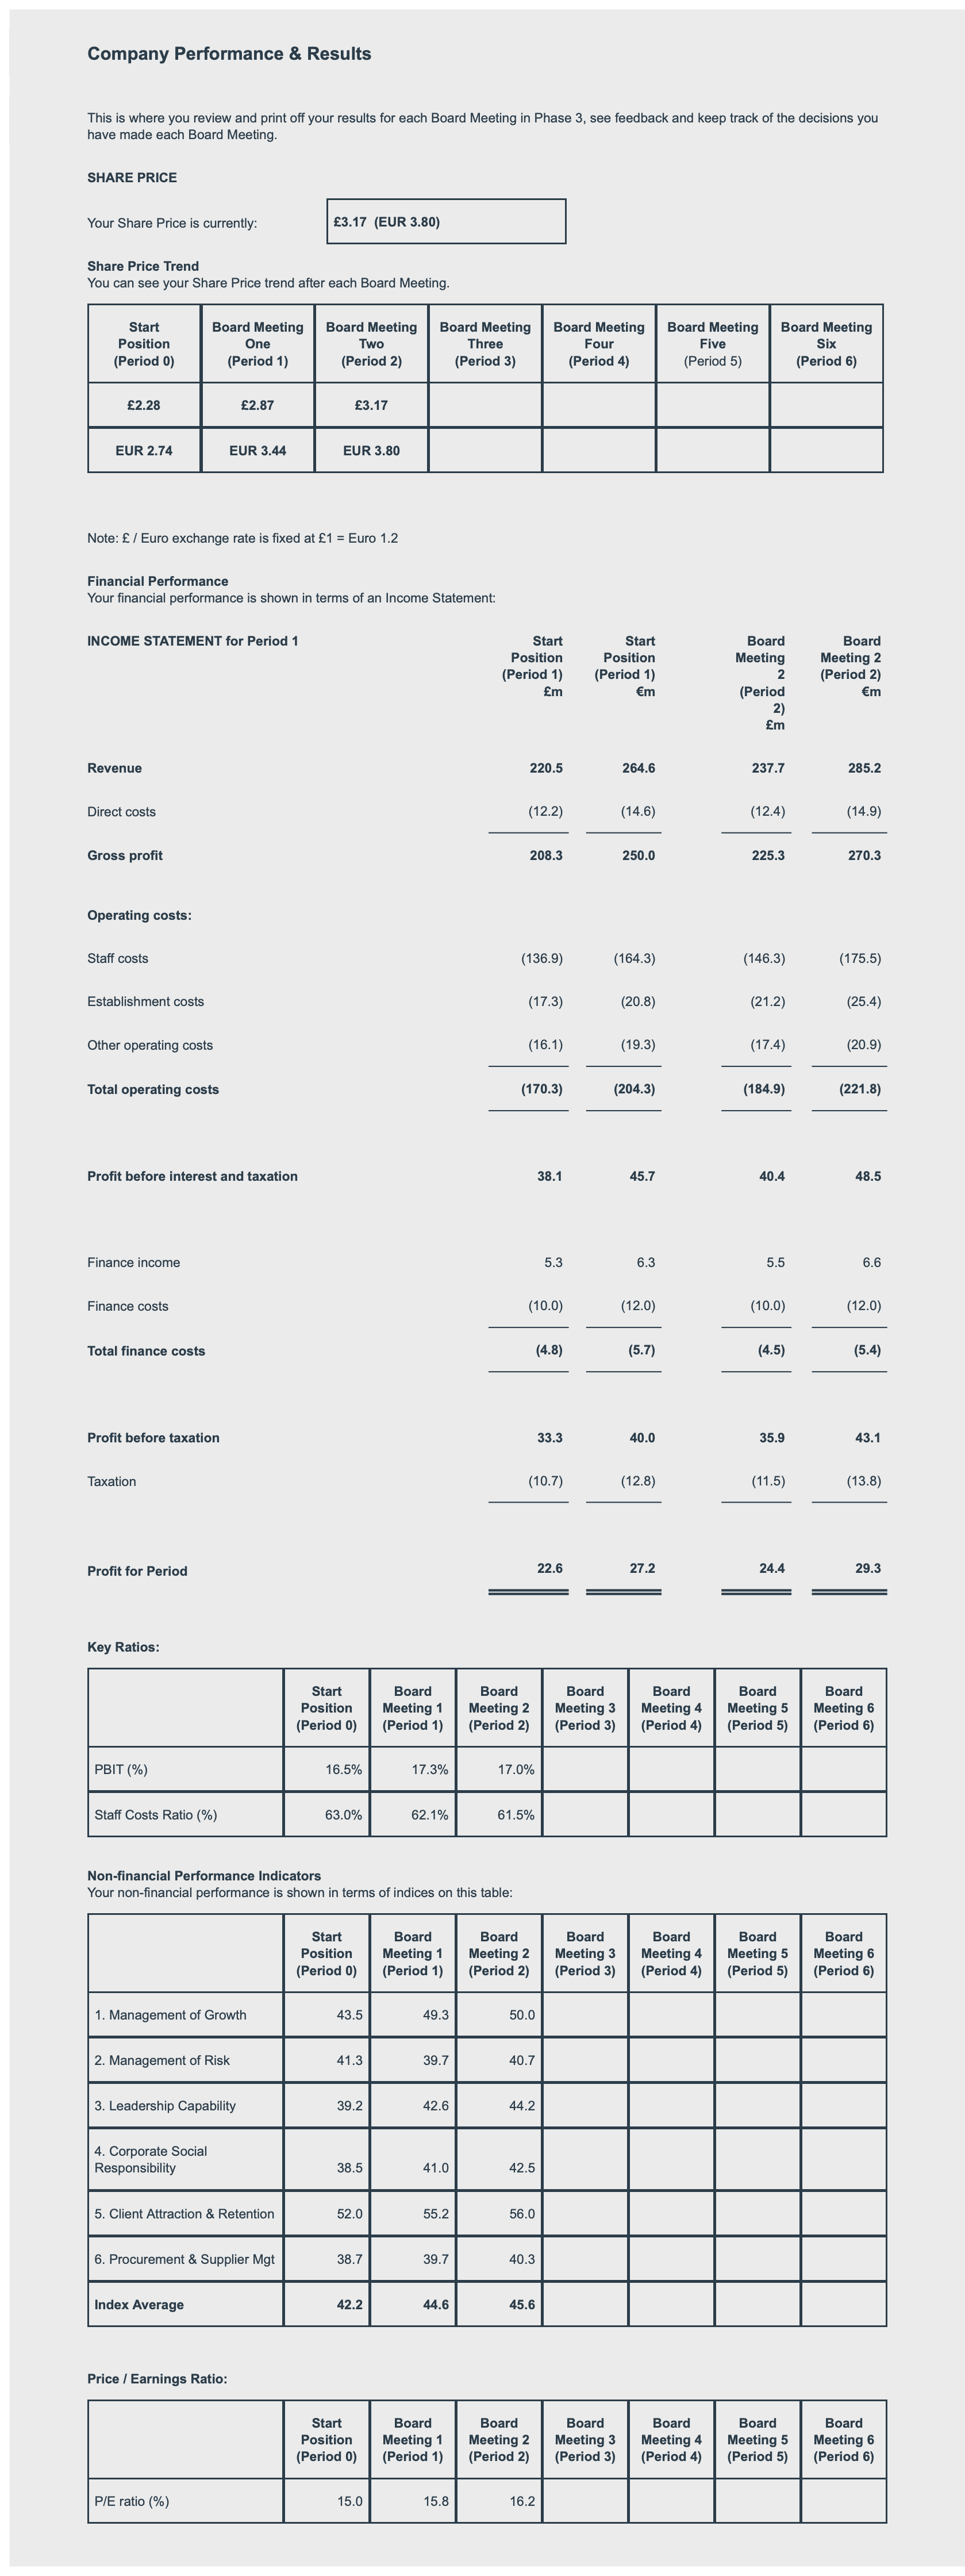
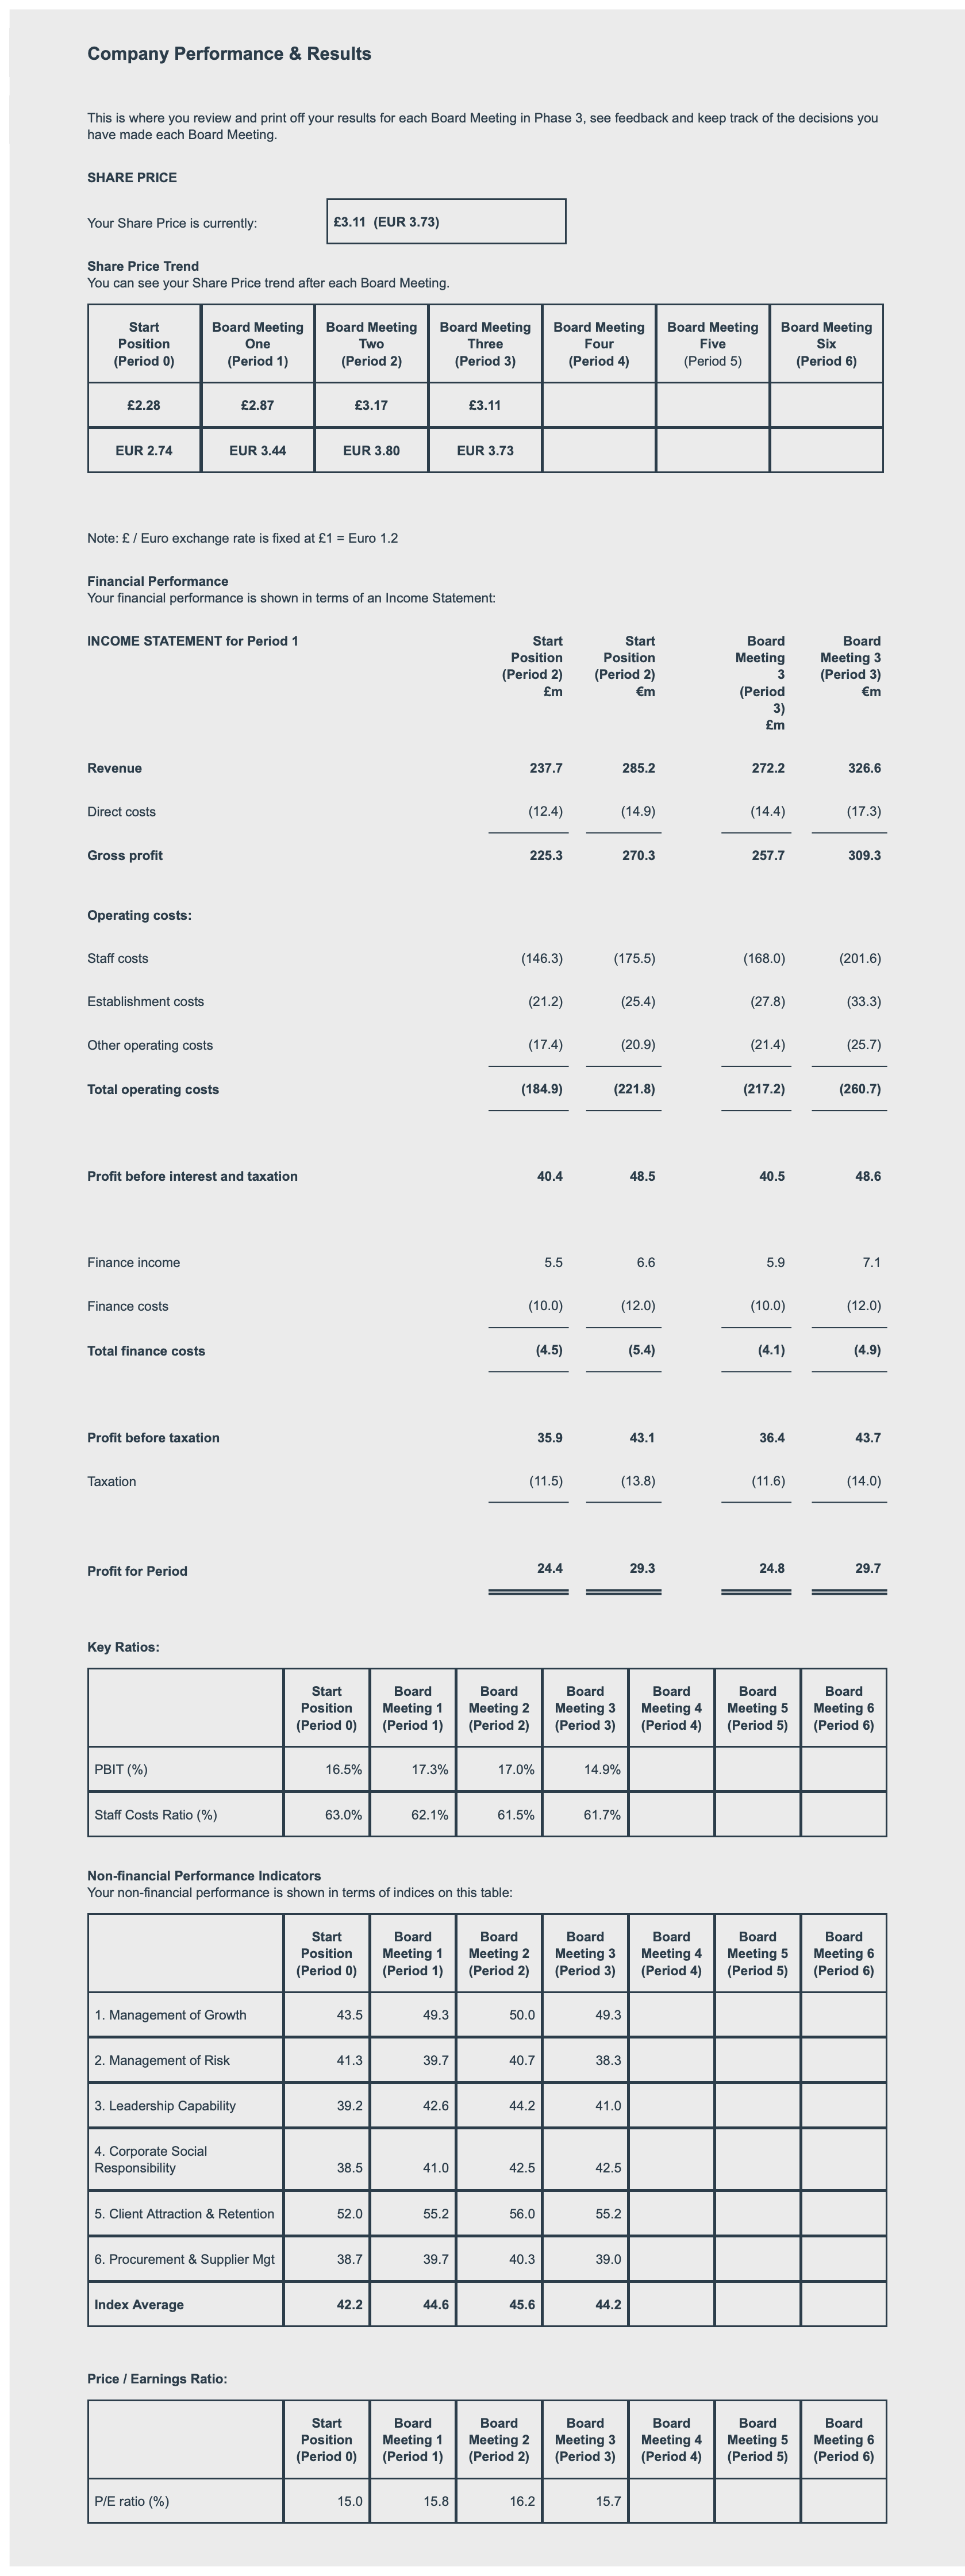
MyStrategyExperience Simulation Company Performance & Results This is where you review and print off your results for each Board Meeting in Phase 3, see feedback and keep track of the decisions you have made e SHARE PRICE Your Share Price is currently E2.87 (EUR 3.44) Share Price Trend You can see your Share Price trend after each Board Meeting. Start Board Meeting Board Meeting Board Meeting Board Meeting Board Meeting Board Meeting One Two Four Five Six (Period 0) (Period 1) (Period 2) (Period 3) ( Period 4) (Period 5) (Period 6) E2.28 E2.87 EUR 2.74 EUR 3.44 Note: E / Euro exchange rate is fixed at $1 = Euro 1.2 Financial Performance Your financial performance is shown in terms of an Income Statement: INCOME STATEMENT for Period 1 Start Start Board Board Position Meeting Meeting 1 Period 0) (Period 1) (Period Revenue 200. 240.0 220.5 264.6 Direct costs (10.0) (12.0) (12.2) ( 14.6 ) Gross profit 190.0 228.0 208.3 250.0 Operating costs: Staff costs (126.0) (151.2) (136.9) (164.3 ) Establishment costs (16.0) (19.2 ) (17.3) (20.8) Other operating costs (15.0) (18,0) (16.1) (19.3) Total operating costs (157.0) ( 188.4 ) (170.3) (204.3) Profit before interest and taxation 33.0 39 .6 38.1 45,7 Finance income 5.0 6.0 6.3 Finance costs (10.0) (12.0) 10.0) (12.0) Total finance costs (5.0) (6.0) (4.8) (5.7) Profit before taxation 28. 33.6 33.3 40.0 Taxation (9.0) 10.8) 10.7) 12.8) Profit for Period 19.0 22.8 22.6 27.2 Key Ratios: Start Board Board Board Board Board Board Position Meeting Meeting 2 Meeting 3 Meeting 4 Meeting 5 Meeting 6 Period 0) (Period 1) (Period 2) (Period 3) (Period 4) (Period 5) (Period 6) BIT (% 16.5% 17.3% Staff Costs Ratio (%) 63.0% 62.1% Non-financial Performance Indicators Your non-financial performance is shown in terms of indices on this table: Start Board Board Board Board Board Position Meeting 1 Meeting 2 Meeting 3 Meeting 4 Meeting 5 Meeting 6 Period 0) (Period 1) (Period 2) (Period 3) (Period 4) (Period 5) (Period 6) Management of Growth 43.5 49.3 2. Management of Risk 41.3 39.7 3. Leadership Capability 39.2 42.6 4. Corporate Social Responsibility 38.5 41.0 5 . Client Attraction & Retention 52.0 55.2 6. Procurement & Supplier Mgt 38.7 39.7 Index Average 42.2 44.6 Price / Earnings Ratio: Start Board Board Board Board Board Board Position Meeting 1 Meeting 2 Meeting 3 Meeting 4 Meeting 5 Meeting 6 (Period 0) (Period 1) (Period 2) (Period 3) (Period 4) (Period 5) ( Period 6) P/E ratio (%) 15.0 15.8 Feedback o view and print feedback on the Agenda Items and Action Options for this Board Meeting, please click here Keep a record of your results: Please keep a record of your results for e ard Meeting by printing this page. Please click the Close button to retur your Learning Review. Print Close Go to Board Meeting 2 (Period 2)Company Performance & Results This is where you review and print off your results for each Board Meeting in Phase 3, see feedback and keep track of the decisions you have made each Board Meeting. SHARE PRICE Your Share Price is currently: E3.17 (EUR 3.80) Share Price Trend You can see your Share Price trend after each Board Meeting. Start Board Meeting Board Meeting Board Meeting Board Meeting Board Meeting Board Meeting Position One Two Three Four Five Six (Period 0) (Period 1) (Period 2) (Period 3) (Period 4) (Period 5) (Period 6) E2.28 $2.87 E3.17 EUR 2.74 EUR 3.44 EUR 3.80 Note: E / Euro exchange rate is fixed at $1 = Euro 1.2 Financial Performance Your financial performance is shown in terms of an Income Statement: INCOME STATEMENT for Period 1 Start Start Board Board Position Position Meeting Meeting 2 (Period 1) (Period 1) (Period 2) Em Em Period Em 2) Em Revenue 220.5 264.6 237.7 285.2 Direct costs (12.2) (14.6) (12.4) 14.9) Gross profit 208.3 250.0 225,3 270.3 Operating costs: Staff costs (136.9) (164.3) (146.3) (175.5) Establishment costs (17.3) (20.8) (21.2) (25.4) Other operating costs (16.1) (19.3) (17.4) 20.9) Total operating costs (170.3) (204.3) (184.9) (221.8) Profit before interest and taxation 38.1 45.7 40.4 48.5 Finance income 0.3 6.3 5.5 6.6 Finance costs (10.0) (12.0) (10.0) (12.0) Total finance costs (4.8) (5.7) (4.5) (5.4) Profit before taxation 33,3 40.0 35.9 43.1 Taxation (10.7) 12.8) (11.5) (13.8) Profit for Period 22.6 27.2 24.4 29.3 Key Ratios: Start Board Board Board Board Board Board Position Meeting 1 Meeting 2 Meeting 3 Meeting 4 Meeting 5 Meeting 6 (Period 0) (Period 1) (Period 2) (Period 3) (Period 4) (Period 5) (Period 6) PBIT (%) 16.5% 17.3% 17.0% Staff Costs Ratio (%) 63.0% 62.1% 61.5% Non-financial Performance Indicators Your non-financial performance is shown in terms of indices on this table: Start Board Board Board Board Board Board Position Meeting 1 Meeting 2 Meeting 3 Meeting 4 Meeting 5 Meeting 6 (Period 0) (Period 1) (Period 2) (Period 3) (Period 4) (Period 5) (Period 6) 1. Management of Growth 43.5 49.3 50.0 2. Management of Risk 41.3 39,7 40.7 3. Leadership Capability 39.2 42 6 44. 4. Corporate Social Responsibility 38.5 41.0 12.5 5. Client Attraction & Retention 52.0 55.2 56.0 6. Procurement & Supplier Mgt 38.7 39.7 40.3 Index Average 42.2 44.6 45.6 Price / Earnings Ratio: Start Board Board Board Board Board Board Position Meeting 1 Meeting 2 Meeting 3 Meeting 4 Meeting 5 Meeting 6 (Period 0) (Period 1) (Period 2) (Period 3) (Period 4) (Period 5) (Period 6) /E ratio (%) 15.0 15.8 16.2Company Performance & Results This is where you review and print off your results for each Board Meeting in Phase 3, see feedback and keep track of the decisions you have made each Board Meeting. SHARE PRICE Your Share Price is currently: E3.11 (EUR 3.73) Share Price Trend You can see your Share Price trend after each Board Meeting. Start Board Meeting Board Meeting Board Meeting Board Meeting Board Meeting Board Meeting Position One Two Three Four Five Six (Period 0) (Period 1) (Period 2) (Period 3) (Period 4) (Period 5) (Period 6) E2.28 $2.87 E3.17 E3.11 EUR 2.74 EUR 3.44 EUR 3.80 EUR 3.73 Note: E / Euro exchange rate is fixed at $1 = Euro 1.2 Financial Performance Your financial performance is shown in terms of an Income Statement: INCOME STATEMENT for Period 1 Start Start Board Board Position Position Meeting Meeting 3 (Period 2) (Period 2) (Period 3) Em Em Period Em 3 ) Em Revenue 237.7 285.2 272.2 326.6 Direct costs (12.4) (14.9) 14.4 17.3) Gross profit 225.3 270.3 257.7 309.3 Operating costs: Staff costs (146.3) (175.5) 168.0) (201.6) Establishment costs (21.2) (25.4) (27.8) (33.3) Other operating costs (17.4) (20.9) (21.4) 25.7) Total operating costs (184.9) (221.8) (217.2) (260.7) Profit before interest and taxation 40.4 48.5 40.5 48.6 Finance income 5.5 6.6 7.1 Finance costs (10.0) (12.0) (10.0) 12.0) Total finance costs (4.5) (5.4) (4.1) (4.9) Profit before taxation 35.9 43.1 36.4 43.7 Taxation (11.5) (13.8) (11.6 (14.0) Profit for Period 24.4 29.3 24.8 29.7 Key Ratios: Start Board Board Board Board Board Board Position Meeting 1 Meeting 2 Meeting 3 Meeting 4 Meeting 5 Meeting 6 (Period 0) (Period 1) (Period 2) (Period 3) (Period 4) (Period 5) (Period 6) PBIT (%) 16.5% 17.3% 17.0% 14.9% Staff Costs Ratio (%) 63.0% 62.1% 61.5% 61.7% Non-financial Performance Indicators Your non-financial performance is shown in terms of indices on this table: Start Board Board Board Board Board Board Position Meeting 1 Meeting 2 Meeting 3 Meeting 4 Meeting 5 Meeting 6 (Period 0) (Period 1) (Period 2) (Period 3) (Period 4) (Period 5) (Period 6) 1. Management of Growth 43.5 49.3 50.0 49.3 2. Management of Risk 41.3 39.7 40.7 38,3 3. Leadership Capability 39.2 42 6 44 41.0 4. Corporate Social Responsibility 38.5 12.5 42.5 5. Client Attraction & Retention 52.0 55.2 56 0 55.2 6. Procurement & Supplier Mgt 38.7 39.7 40.3 39.0 Index Average 42.2 44.6 45.6 44. Price / Earnings Ratio: Start Board Board Board Board Board Board Position Meeting 1 Meeting 2 Meeting 3 Meeting 4 Meeting 5 Meeting 6 (Period 0) (Period 1) (Period 2) (Period 3) (Period 4) (Period 5) (Period 6) /E ratio (%) 15.0 15.8 16.2 15.7
Step by Step Solution
There are 3 Steps involved in it

Get step-by-step solutions from verified subject matter experts