

Question: 1. Based on the below graph answer the questions below. Cost Volume Profit graph $ 80,000 70,000 60,000 50,000 40,000 30,000 20,000 10,000 500 1.000
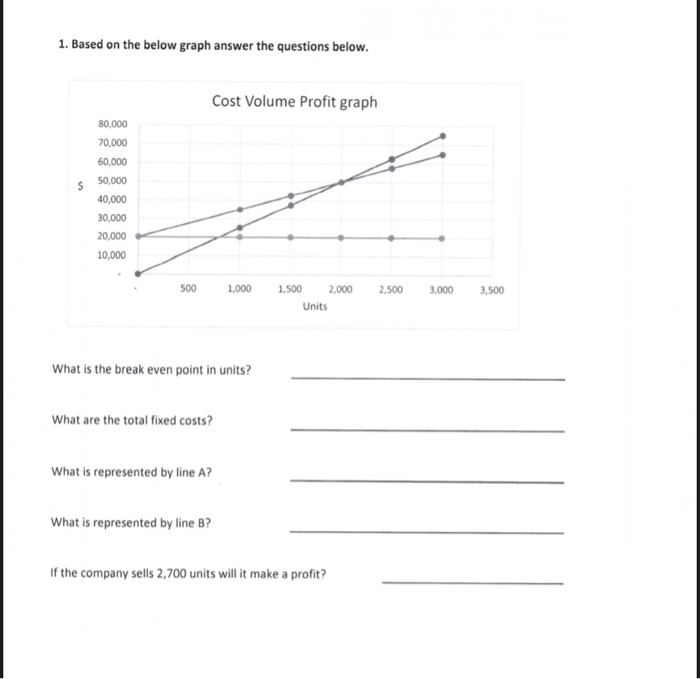
1. Based on the below graph answer the questions below. Cost Volume Profit graph $ 80,000 70,000 60,000 50,000 40,000 30,000 20,000 10,000 500 1.000 1,500 2,000 Units 2.500 3,000 3,500 What is the break even point in units? What are the total fixed costs? What is represented by line A? What is represented by line B? If the company sells 2,700 units will it make a profit
Step by Step Solution
There are 3 Steps involved in it
1 Expert Approved Answer
Step: 1 Unlock

Question Has Been Solved by an Expert!
Get step-by-step solutions from verified subject matter experts
Step: 2 Unlock
Step: 3 Unlock