

Question: 1- Based on the data below, does the books distribution depend on field (A, B, or C)? A Sales B Sales C Sales 2- Using
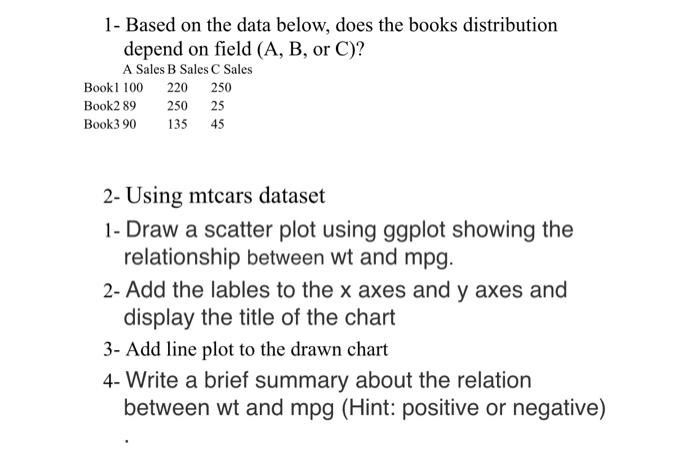
1- Based on the data below, does the books distribution depend on field (A, B, or C)? A Sales B Sales C Sales 2- Using mtcars dataset 1- Draw a scatter plot using ggplot showing the relationship between w and mpg. 2- Add the lables to the x axes and y axes and display the title of the chart 3- Add line plot to the drawn chart 4- Write a brief summary about the relation between wt and mpg (Hint: positive or negative)
Step by Step Solution
There are 3 Steps involved in it
1 Expert Approved Answer
Step: 1 Unlock

Question Has Been Solved by an Expert!
Get step-by-step solutions from verified subject matter experts
Step: 2 Unlock
Step: 3 Unlock