

Question: 1. Based on the data in case Exhibits 1 and 4, is Costcos financial performance superior to that at Sams Club and BJs Wholesale? 2.
1. Based on the data in case Exhibits 1 and 4, is Costcos financial performance superior to that at Sams Club
and BJs Wholesale?
2. Does the data in case Exhibit 2 indicate that Costcos expansion outside the U.S. is financially successful?
Why or why not?
3. How well is Costco performing from a strategic perspective? Does Costco enjoy a competitive advantage
over Sams Club? Over BJs Wholesale? If so, what is the nature of its competitive advantage? Does Costco
have a winning strategy? Why or why not?
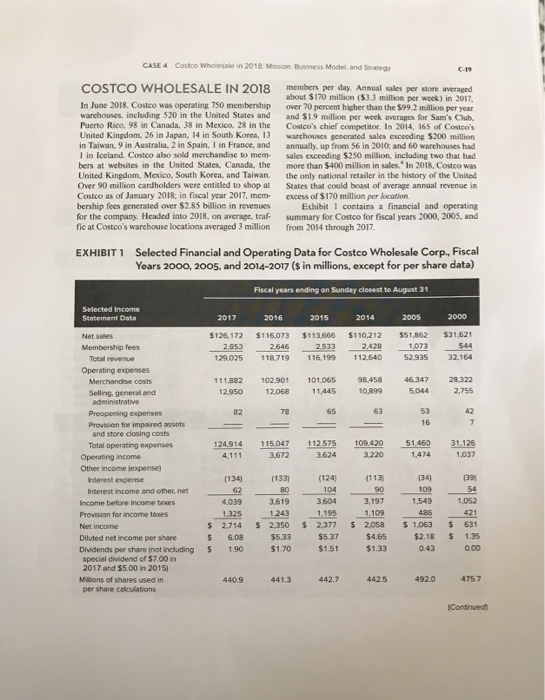
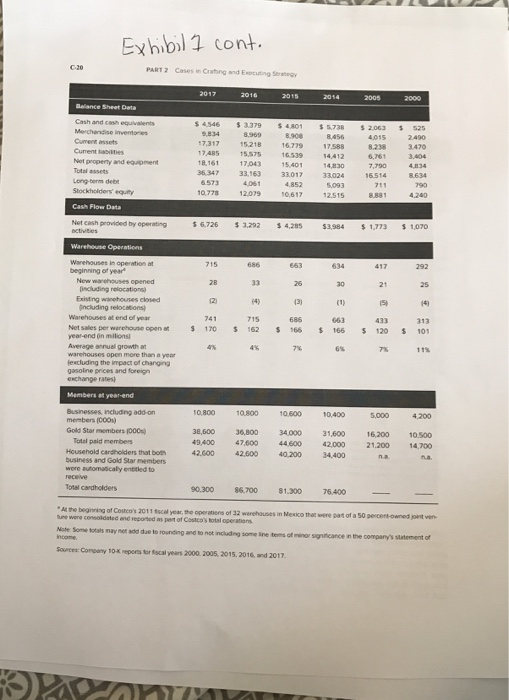
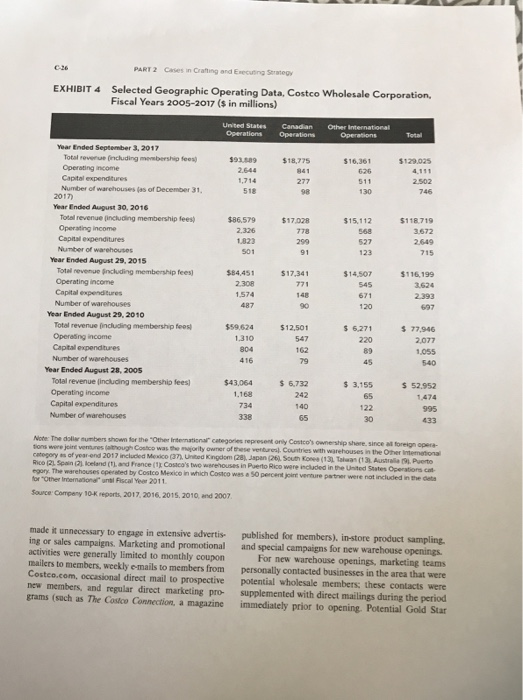
CASE 4 Costco Wholesale in 2018: Mission, Business Model, and Strategy COSTCO WHOLESALE IN 2018 members per day. Ansual sales per store averaged about $170 million($3.3 million per wock) in 2017 In June 2018, Costco was operating 750 membership over 70 percent higher than the $99.2 million per year warchouses, including 520 in the United States and and $1.9 million per week averages for Sam's Club, Puerto Rico, 98 in Canada, 38 in Mexico, 28 in the Costco's chief competitor. In 2014, 165 of Costco's United Kingdom, 26 in Japan, 14 in South Korea, 13 warchouses gencrated sales excooding $200 million in Taiwan, 9 in Australia. 2 in Spain, I in France, and annually, up from $6 in 2010, and 60 warehouses had I in locland. Costoo also sold merchandse to mem sales exceeding $250 million, inclading two that had bers at websites in the United States, Canada, the more than $400 million in sales." In 2018, Costco was United Kingdom, Mexico, South Korea, and Taiwan. the only national retailer in the history of the United Over 90 million cardholders were entitled to shop at States that could boast of average annual revenue in Costco as of January 2018: in fiscal year 2017, memexcess of S170 million per location bership fees generated over $2.85 billion in revenues for the company. Headed into 2018, on average, traf summary for Costco for fiscal years 2000, 2005, and fie at Costco's warehouse locations averaged 3 million from 2014 through 2017 Exhibit 1 contains a financial and operating Selected Financial and Operating Data for Costco Wholesale Corp., Fiscal Years 2000, 2005, and 2014-2017 ($ in millions, except for per share data) EXHIBIT1 Fiscal years ending on Sunday closest to August 31 Selected Income Statement Datn 2005 2017 2016 2014 $126,172 $116.073 $113,666$110,212 $51,862 $31,621 Net seles 28532646 25332428 1072544 129,025 118,719 116,199 112.64052.935 32.164 Membership fees Total revenue Operating expenses Merchandise costs 111,882 102.901 101,065 98.458 46,347 28.322 12,950 12,06811,445 10899 5.0442,755 Selling, general and administrative Provision for impaired assets and store closing costs 124.914 115.047 112575 109420 51460 31.126 3,624 Total operating expenses Operating income Other income lexpense) (134) (133 (124 (113 (34) hterest experse Interest income and other, net 1,052 3.619 3604 3,197 1,549 Income before income taxes 1.3251.2431.1951,109486421 s 2,714 $ 2.350 2.377 2.058 1,063 $ 631 6.08 $5.33 $5.37 190 Provision for income taxes Net income $465 $%2.18 1.35 Diluted net income per share Dividends per share (not including special dividend of $7.00 in 2017 and $5.00 in 2015) $1.90 $1.70 $1.51 $1.33 043 00 4409 441.3442.7 442.5 492.0 4757 Maons of shares used in per share calculations Exhibil 1 cont PART 2 Cases in Crating and Expcuting S Cash and cash equivalents $4,546 %3.379 S4RO1 %5738 S2063 % S25 8.908 8,456 17,317 15218 16779 175888.238 347 17,48515575 139 14,412 6,761 18.161 Cument assets Current lailties Net property and equipment 17.043 4,834 4830 7,700 36.347 33,163 33017 33024 16514 8.634 Total assets 6573 Long -torm debe ,093 8.881 10,778 Stockholders equity 1207910,617 4,285 $3.984 $1,773 s 1070 6.726 3,292 Net cash provided by eperating Warehouses in beginning of year New warehouses opened 21 30 Existing wanehouses closed Including relocations) Warehouses at end of year Net sales per warehouse openot 14) 13) 741 715 663 170 $ 162 $ 166 % 166 $ 120 S 101 year-end on milions 11% Averege annuel growth at than a yea lexcluding the impact of changing gasolne prices and foreign eschange rates Members at year-encd Businesses, including add-on members (COOs) Gold Star members (000) Total paid members Household cardholders that both business and Gold Star members were automasicaly enttked to 10,400 10,800 10,800 38,600 36,800 34,000 31,600 16200 10.500 47600 44,600 42000 21.200 14,700 42.600 42,600 40 34,400 90,300 86700 81.0 7 76.400 Total cardholders At the beginning of Costco's 2011 scal year, the operatiens of 32 were consoldated ,d reported as pen of Costcostotaioeziom Mexico that were pat of a 50 percert-owned joint ven werehouses to rounding and to not includng some line tems of manor signiticance n the company's statement of Note: Some totals nay not add due Sarett Crpany 10-K nepostor tscal years 2000 2005. 2015, 2016, and 2017. t PART 2 Cases in Crafting and Enecuting Strategy EXHIBIT 4 Selected Geographic Operating Data, Costco Wholosale Corporation, Fiscal Years 2005-2017 (s in millions) United States Canadian Other International Year Ended September 3, 2017 Total reverue (including mombership fees) Operating income $93.89 $18,775 $16,361 129.025 Capital expenditures 1,714 Number of warehouses(as of December 31 2017) 518 Year Ended August 30, 2016 Total revenue jincluding membership fees) Operating income $86.579 $17.028 778 $15,112 $118.719 568 Capital expenditures 1823 527 501 123 91 Year Ended August 29, 2015 Totel revenue gncluding membership fees Operating income Capital expenditures $14,507 $116,199 $84.451 3624 1,574 671 2.393 Number of warehouses 120 Year Ended August 29, 2010 Total revenue fincluding membership fees Operaing income Capitall expendtures $59,624 $ 6,271 77,946 $12.501 1.310 547 220 2,077 1,055 Number of warehouses 416 79 540 Year Ended August 28, 2005 Total revenue (including membership fees) $43,064 6732 $ 3,155 52.952 Operating income Capital expenditures 242 1474 734 122 995 Number of warehouses 338 65 Note: The doliar aumbers shown for the "Other iritermational" c tions were jeire ventunes (athough Costco was the majority owner of these ventures Countries with warehouses in the category as of year -end 2017 inclucled Mexico (37), United Kingdom (28), Japan (26), South Koes (13)Talwan (13 Australia Rico PL Span (2) keland (t L and France (1, Casaco's te war enouses n P erto Rico were na ded in Unted egory The warehouses operated by Costco Mexico in which Costco was a 50 percent joire venture partner were not included in for "Other Irternationa" unbl Fiscall Yeer 2011 categories represent ony Costcos ownership shere, since al foreign opera- Other Iintermational Source Compeny 10-K reports, 2017, 2016 2015, 2010, and 2007 made it unnecessary to engage in extensive advertis- ing or sales campaigns, Marketing and promotional and special campaigns for new warehouse openings activities were generally limited to monthly coupon mailers to members, weekly e-mails to members from personally contacted businesses in the area that were Costco.com, occasional direct mail to prospective potential wholesale members these contacts were new members, and regular direct marketing pro- supplemented with direct mailings during the period grams (such as The Costco Connection, a magazine immediately prior to opening. Potential Gold Star published for members). in-store product sampling For new warehouse openings, marketing teams
Step by Step Solution
There are 3 Steps involved in it

Get step-by-step solutions from verified subject matter experts