

Question: 1. Based on the empirical patterns in Figure 1 below, answer the following questions. Figure 1: M0 vs. M1, 2005-2022 a) Based on the definitions
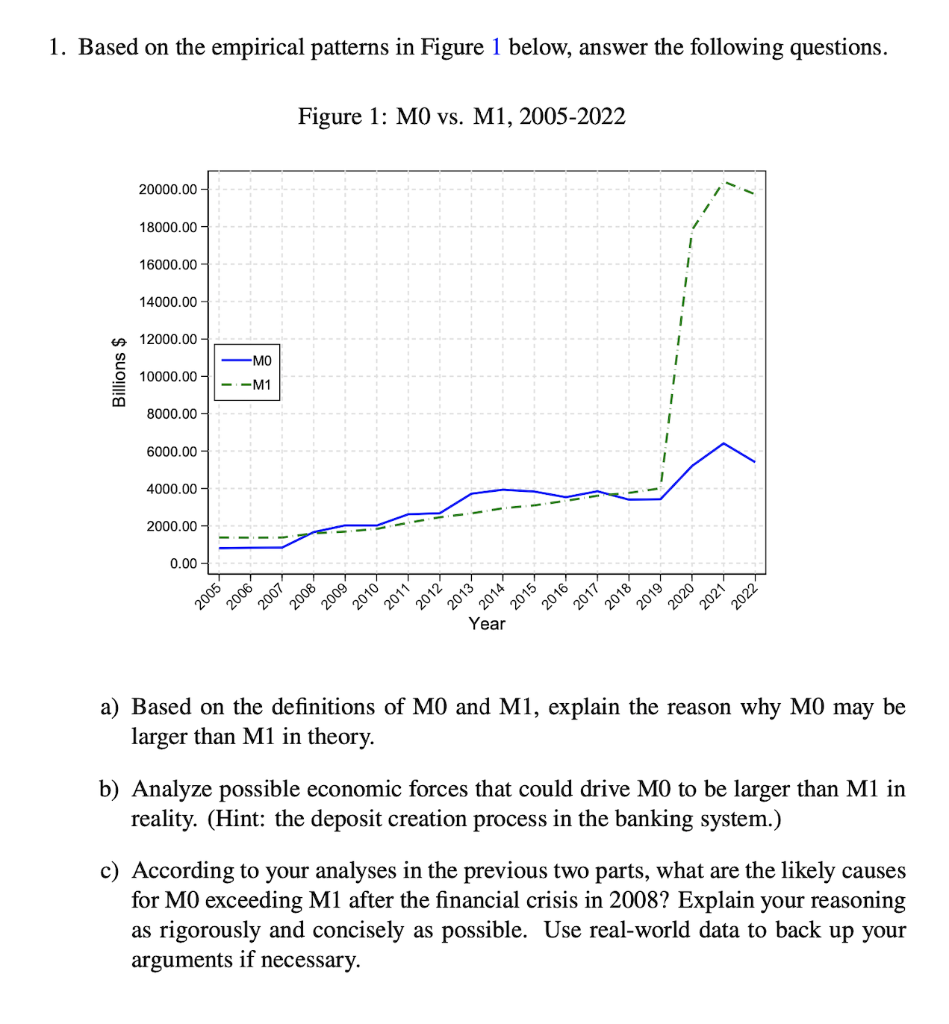
1. Based on the empirical patterns in Figure 1 below, answer the following questions. Figure 1: M0 vs. M1, 2005-2022 a) Based on the definitions of M0 and M1, explain the reason why M0 may be larger than M1 in theory. b) Analyze possible economic forces that could drive M0 to be larger than M1 in reality. (Hint: the deposit creation process in the banking system.) c) According to your analyses in the previous two parts, what are the likely causes for M0 exceeding M1 after the financial crisis in 2008? Explain your reasoning as rigorously and concisely as possible. Use real-world data to back up your arguments if necessary. 1. Based on the empirical patterns in Figure 1 below, answer the following questions. Figure 1: M0 vs. M1, 2005-2022 a) Based on the definitions of M0 and M1, explain the reason why M0 may be larger than M1 in theory. b) Analyze possible economic forces that could drive M0 to be larger than M1 in reality. (Hint: the deposit creation process in the banking system.) c) According to your analyses in the previous two parts, what are the likely causes for M0 exceeding M1 after the financial crisis in 2008? Explain your reasoning as rigorously and concisely as possible. Use real-world data to back up your arguments if necessary
Step by Step Solution
There are 3 Steps involved in it

Get step-by-step solutions from verified subject matter experts