

Question: 1) based on your scatter diagram is the relationship between variables? If yes describe the relationship. 2) does it appear to be positive or negative?
1) based on your scatter diagram is the relationship between variables? If yes describe the relationship. 2) does it appear to be positive or negative? Strong or weak or moderate? 3) what were your guess of the correlation coefficient be?
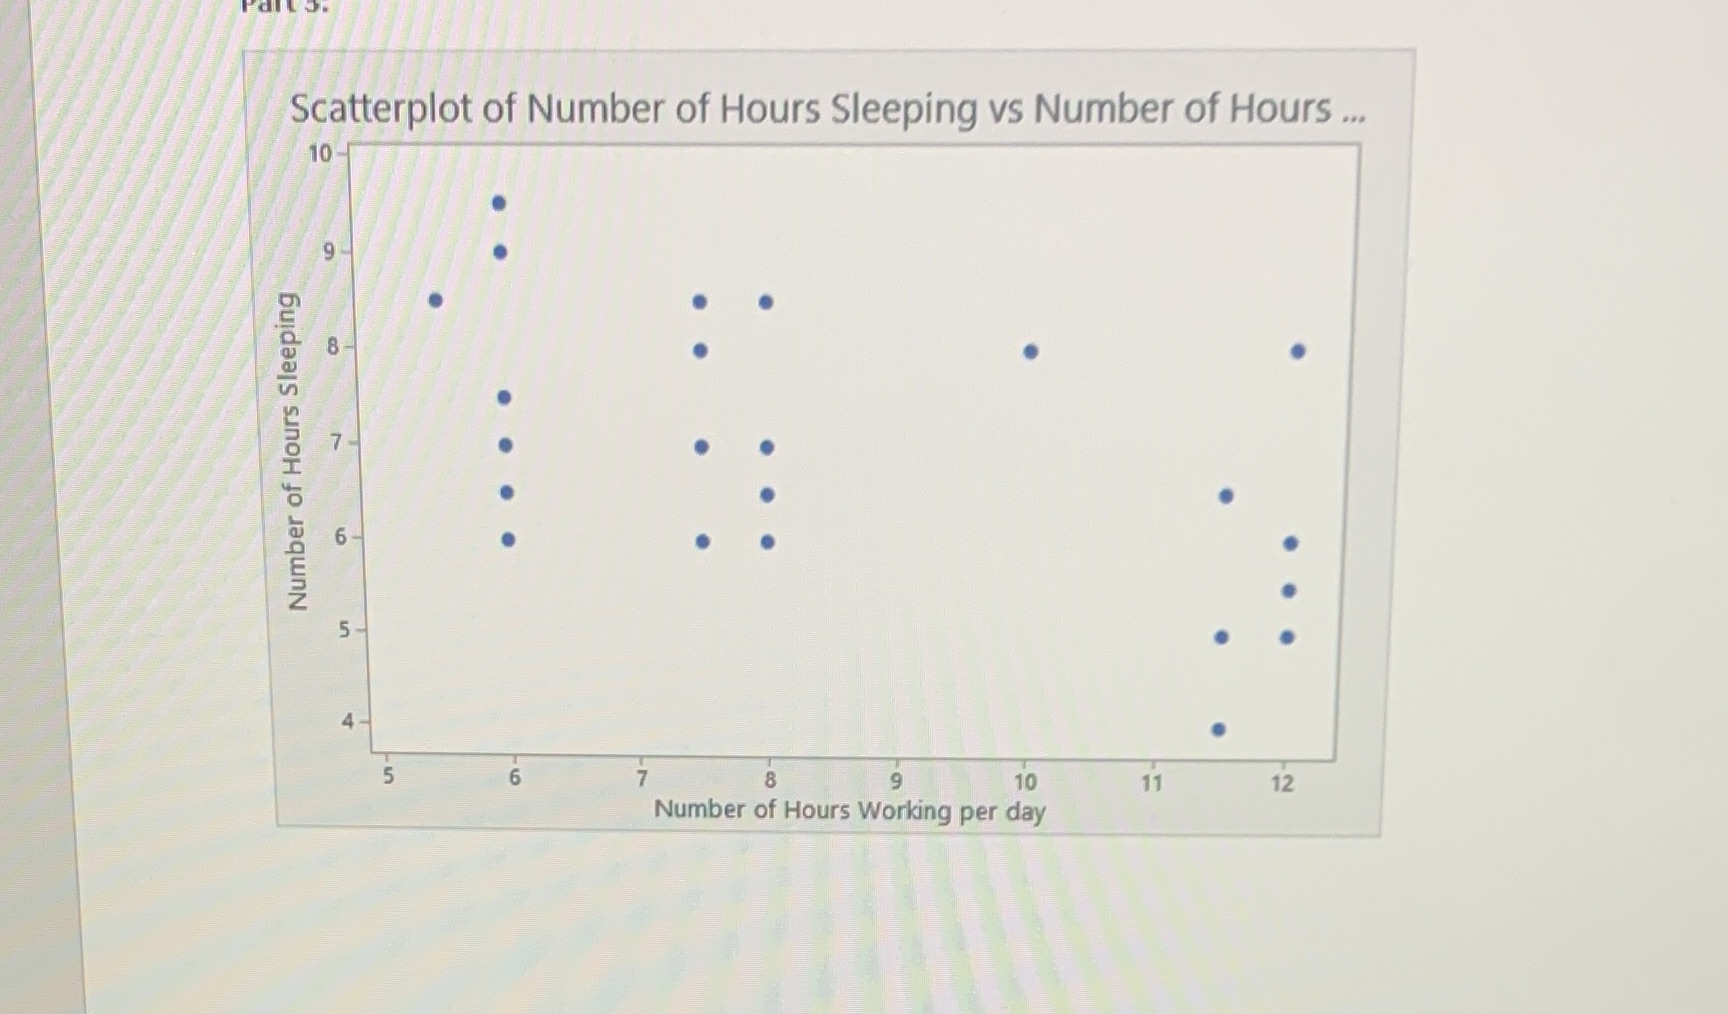
Scatterplot of Number of Hours Sleeping vs Number of Hours ... 10 9 8 7 . Number of Hours Sleeping . . 6 5 4 UY 7 8 9 10 11 12 Number of Hours Working per day
Step by Step Solution
There are 3 Steps involved in it
1 Expert Approved Answer
Step: 1 Unlock

Question Has Been Solved by an Expert!
Get step-by-step solutions from verified subject matter experts
Step: 2 Unlock
Step: 3 Unlock