

Question: 1. Based on your variance analysis, create an explanation for the changes to overall performance of the operation . Include any causes and impact of
1. Based on your variance analysis, create an explanation for the changes to overall performance of the operation. Include any causes and impact of the numbers presented in your explanation.
a. Based on your variance analysis, create an explanation for the changes to the sales mix of the operation. Include any causes and impact of the numbers presented in your explanation. NOTE: Please use real world reasons as to these changes.
b. Based on your variance analysis, create an explanation for the changes to the cost of sales mix of the operation. Include any causes and impact of the numbers presented in your explanation. NOTE: Please use real world reasons as to these changes
c. Based on your variance analysis, create an explanation for the changes to the prime costs of the operation. Include any causes and impact of the numbers presented in your explanation. NOTE: Please use real world reasons as to these changes
d. Based on your variance analysis, create an explanation for the changes to the controllable expenses of the operation. Include any causes and impact of the numbers presented in your explanation. NOTE: Please use real world reasons as to these changes
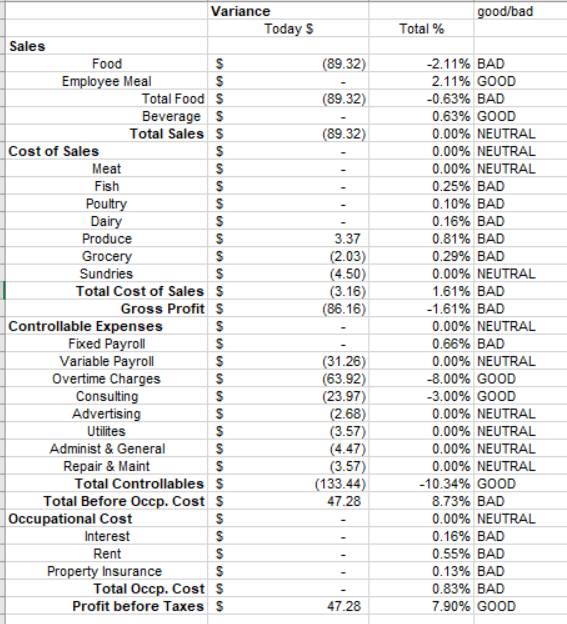
good/bad Total% Variance Today S Sales Food (89.32) Employee Meal Total Foods (89.32) Beverage 5 Total Sales S (89.32) Cost of Sales Meat Fish Poultry Dairy Produce 3.37 Grocery (2.03) Sundries (4.50) Total Cost of Sales $ (3.16) Gross Profits (86.16) Controllable Expenses Fixed Payroll Variable Payroll (31.26) Overtime Charges (63.92) Consulting (23.97) Advertising (2.68) Utilites (3.57) Administ & General (4.47) Repair & Maint (3.57) Total Controllables S (133.44) Total Before Occp. Cost s 47.28 Occupational Cost Interest Rent Property Insurance Total Occp. Costs Profit before Taxes S 47.28 -2.11% BAD 2.11% GOOD -0.63% BAD 0.63% GOOD 0.00% NEUTRAL 0.00% NEUTRAL 0.00% NEUTRAL 0.25% BAD 0.10% BAD 0.16% BAD 0.81% BAD 0.29% BAD 0.00% NEUTRAL 1.61% BAD -1.61% BAD 0.00% NEUTRAL 0.66% BAD 0.00% NEUTRAL -8.00% GOOD -3.00% GOOD 0.00% NEUTRAL 0.00% NEUTRAL 0.00% NEUTRAL 0.00% NEUTRAL -10.34% GOOD 8.73% BAD 0.00% NEUTRAL 0.16% BAD 0.55% BAD 0.13% BAD 0.83% BAD 7.90% GOOD good/bad Total% Variance Today S Sales Food (89.32) Employee Meal Total Foods (89.32) Beverage 5 Total Sales S (89.32) Cost of Sales Meat Fish Poultry Dairy Produce 3.37 Grocery (2.03) Sundries (4.50) Total Cost of Sales $ (3.16) Gross Profits (86.16) Controllable Expenses Fixed Payroll Variable Payroll (31.26) Overtime Charges (63.92) Consulting (23.97) Advertising (2.68) Utilites (3.57) Administ & General (4.47) Repair & Maint (3.57) Total Controllables S (133.44) Total Before Occp. Cost s 47.28 Occupational Cost Interest Rent Property Insurance Total Occp. Costs Profit before Taxes S 47.28 -2.11% BAD 2.11% GOOD -0.63% BAD 0.63% GOOD 0.00% NEUTRAL 0.00% NEUTRAL 0.00% NEUTRAL 0.25% BAD 0.10% BAD 0.16% BAD 0.81% BAD 0.29% BAD 0.00% NEUTRAL 1.61% BAD -1.61% BAD 0.00% NEUTRAL 0.66% BAD 0.00% NEUTRAL -8.00% GOOD -3.00% GOOD 0.00% NEUTRAL 0.00% NEUTRAL 0.00% NEUTRAL 0.00% NEUTRAL -10.34% GOOD 8.73% BAD 0.00% NEUTRAL 0.16% BAD 0.55% BAD 0.13% BAD 0.83% BAD 7.90% GOOD
Step by Step Solution
There are 3 Steps involved in it

Get step-by-step solutions from verified subject matter experts