

Question: Based on your variance analysis, create an explanation for the changes to overall performance of the operation. Include any causes and impact of the numbers

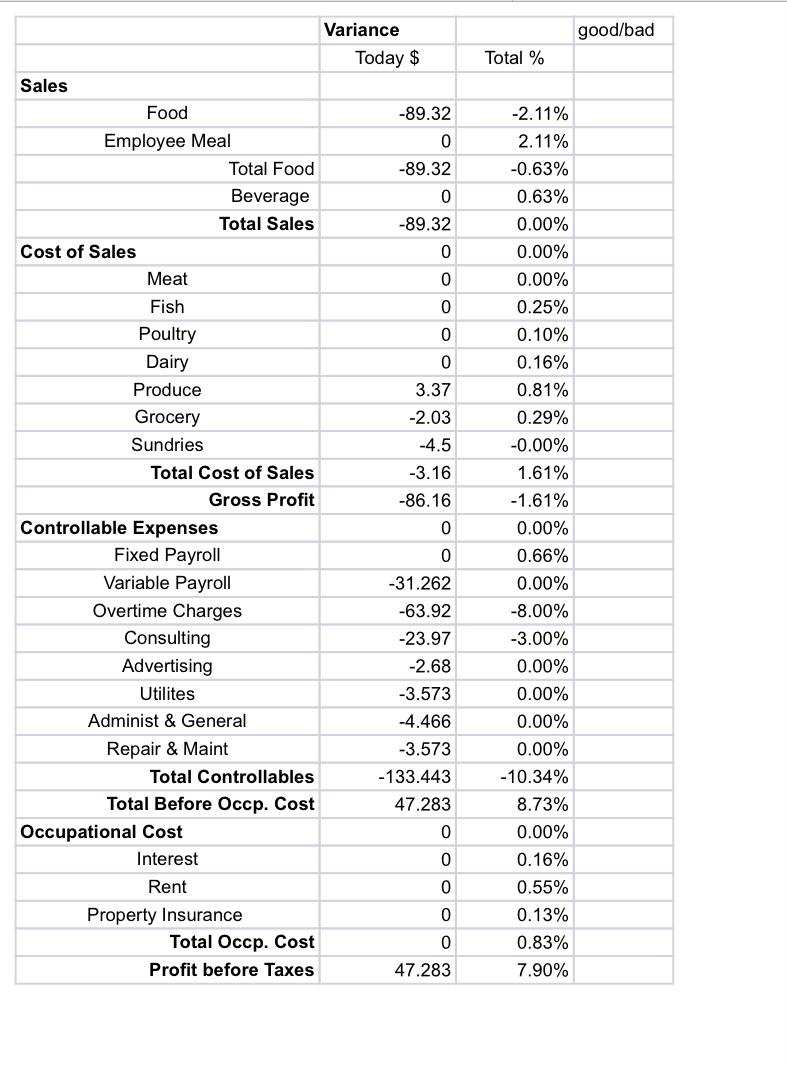

Based on your variance analysis, create an explanation for the changes to overall performance of the operation. Include any causes and impact of the numbers presented in your explanation. NOTE: Please use real world reasons as to these changes. 6 good/bad Total % Variance Today $ Sales Food -89.32 Employee Meal 0 Total Food -89.32 Beverage 0 Total Sales -89.32 Cost of Sales 0 Meat 0 Fish 0 Poultry 0 Dairy 0 Produce 3.37 Grocery -2.03 Sundries -4.5 Total Cost of Sales -3.16 Gross Profit -86.16 Controllable Expenses 0 Fixed Payroll 0 Variable Payroll -31.262 Overtime Charges -63.92 Consulting -23.97 Advertising -2.68 Utilites -3.573 Administ & General -4.466 Repair & Maint -3.573 Total Controllables -133.443 Total Before Occp. Cost 47.283 Occupational Cost 0 Interest 0 Rent 0 Property Insurance 0 Total Occp. Cost 0 Profit before Taxes 47.283 -2.11% 2.11% -0.63% 0.63% 0.00% 0.00% 0.00% 0.25% 0.10% 0.16% 0.81% 0.29% -0.00% 1.61% -1.61% 0.00% 0.66% 0.00% -8.00% -3.00% 0.00% 0.00% 0.00% 0.00% -10.34% 8.73% 0.00% 0.16% 0.55% 0.13% 0.83% 7.90% Using the Variance Report provided below, label each of the line items either good or bad and submit the revised sheet to this question. Use a standard variance of + or -0.5%) when asked to evaluate the results using the % as the number
Step by Step Solution
There are 3 Steps involved in it

Get step-by-step solutions from verified subject matter experts