

Question: 1. Based upon this historical data, do you think that the starting deseasonal forecast (as of January 1, 2022) of 1200 for problem 1 is
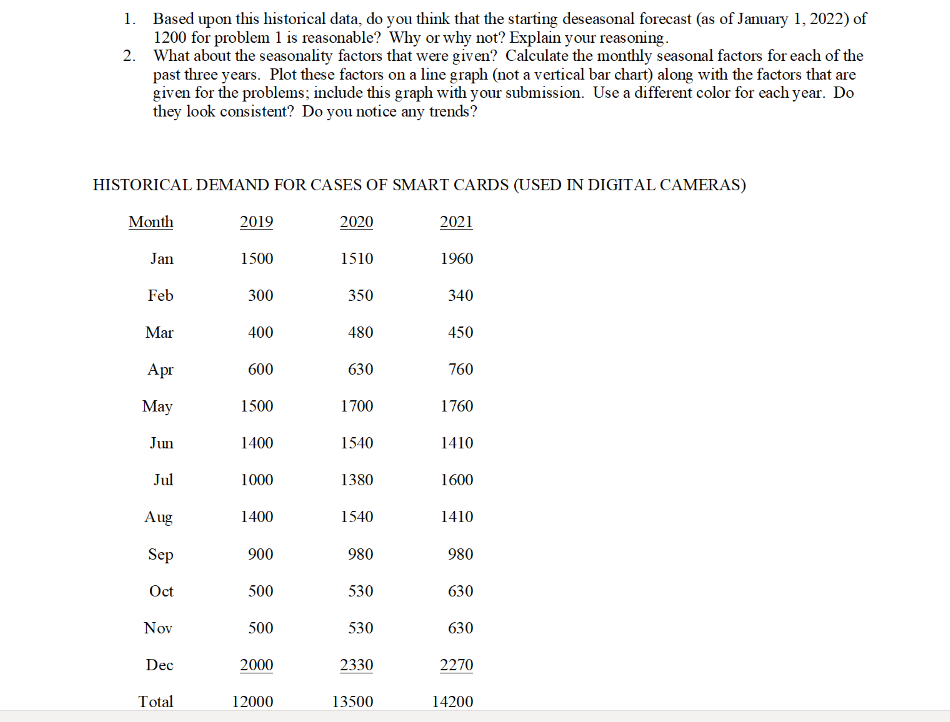
1. Based upon this historical data, do you think that the starting deseasonal forecast (as of January 1, 2022) of 1200 for problem 1 is reasonable? Why or why not? Explain your reasoning. 2. What about the seasonality factors that were given? Calculate the monthly seasonal factors for each of the past three years. Plot these factors on a line graph (not a vertical bar chart) along with the factors that are given for the problems; include this graph with your submission. Use a different color for each year. Do they look consistent? Do you notice any trends? HISTORICAL DEMAND FOR CASES OF SMART CARDS (USED IN DIGITAL CAMERAS)
Step by Step Solution
There are 3 Steps involved in it

Get step-by-step solutions from verified subject matter experts