

Question: 1 Below you are given a partial computer output based on a sample of 7 observations,relating an independent variable(x) and a dependent variable(y). Predictor Coefficient
1
Below you are given a partial computer output based on a sample of 7 observations,relating an independent variable(x) and a dependent variable(y).
Predictor Coefficient Standard Error
Constant 24.112 8.376
X -0.252 0.253
Analysis of Variance
Source SS
Regression 196.893
Error 94.822
1.To test for the signifiance of the slope,what is the t test statistics?
A 3.222
B 2.650
C 3.986
D 4.126
2.To perform an F test, what is the F test statistic?
A 9.766
B 9.932
C 10.382
D 11.010
3.What is the coefficient of determination?
A 0.545
B 0.675
C 0.776
D 0.798
2)
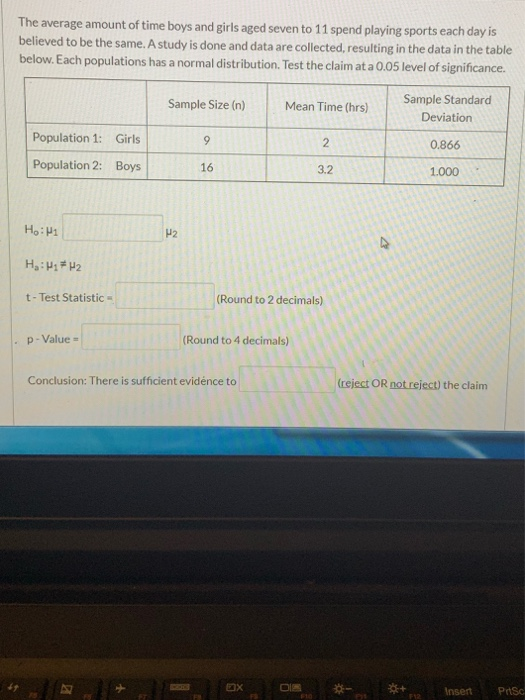
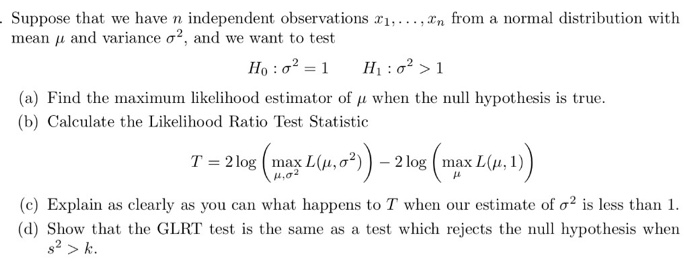
The average amount of time boys and girls aged seven to 11 spend playing sports each day is believed to be the same. A study is done and data are collected, resulting in the data in the table below. Each populations has a normal distribution. Test the claim at a 0.05 level of significance. Sample Size (n) Mean Time (hrs) Sample Standard Deviation Population 1: Girls 9 2 0.866 Population 2: Boys 16 3.2 1.000 Ho: H1 H2 Ha: H1 # H2 t - Test Statistic = [Round to 2 decimals) p - Value = (Round to 4 decimals) Conclusion: There is sufficient evidence to (reject OR not reject) the claim Insert PriSoSuppose that we have n independent observations :1, ..., In from a normal distribution with mean / and variance o', and we want to test Ho : 0' = 1 H1:0->1 (a) Find the maximum likelihood estimator of / when the null hypothesis is true. (b) Calculate the Likelihood Ratio Test Statistic T = 2log (max L(u, 62) ) - 2 log max L(/, 1) (c) Explain as clearly as you can what happens to T when our estimate of o' is less than 1. (d) Show that the GLRT test is the same as a test which rejects the null hypothesis when s' > k
Step by Step Solution
There are 3 Steps involved in it

Get step-by-step solutions from verified subject matter experts