

Question: 1 Big Picture Project Sample - ACCT2003 2021 21. Issue Stock for 3,000 3 2. Sien Note to borrow 4,000 6 4 3. Purchale Equipment
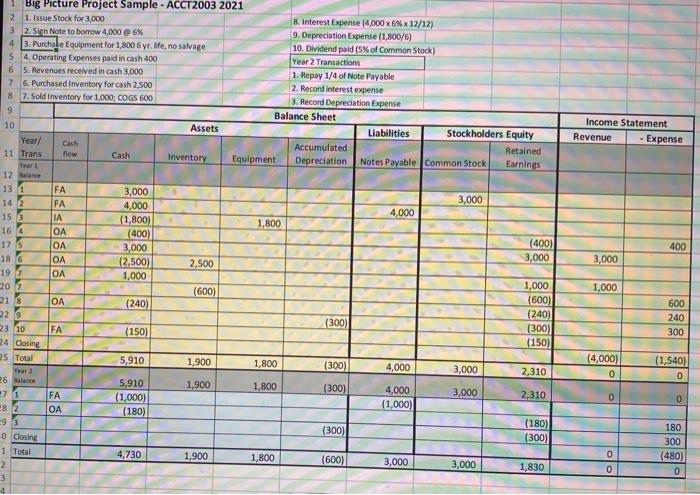
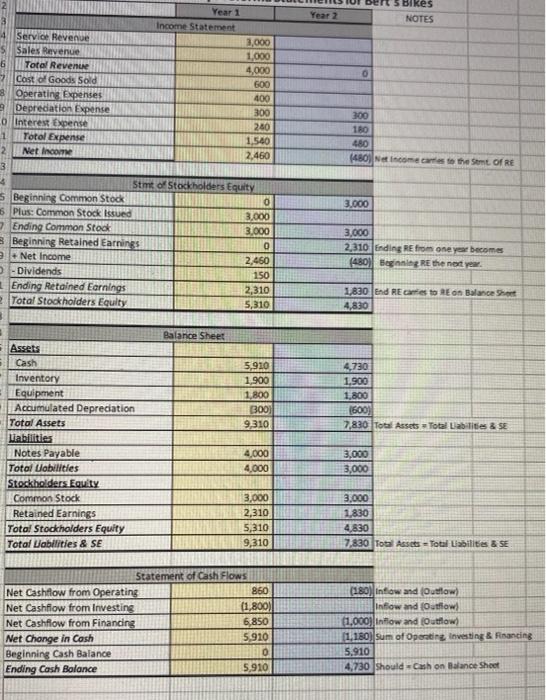
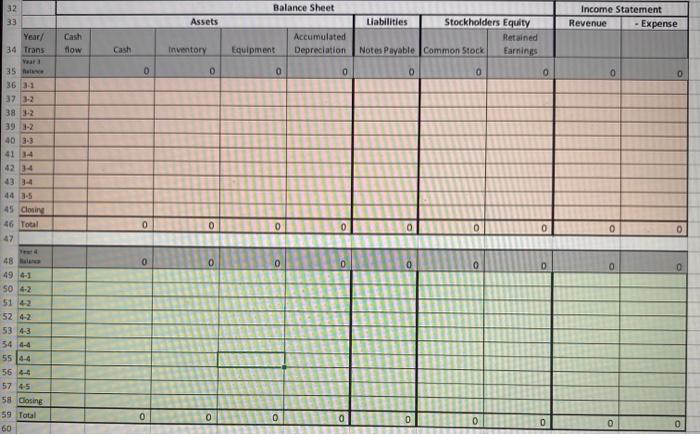
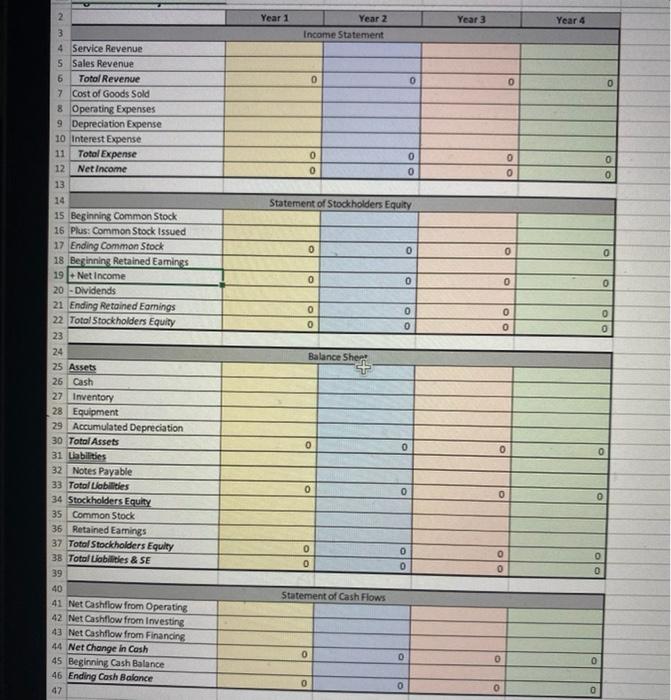
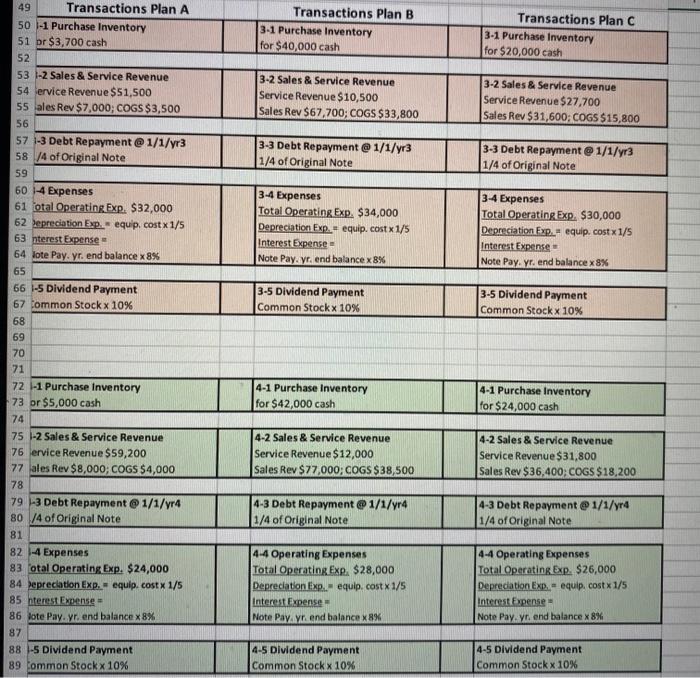
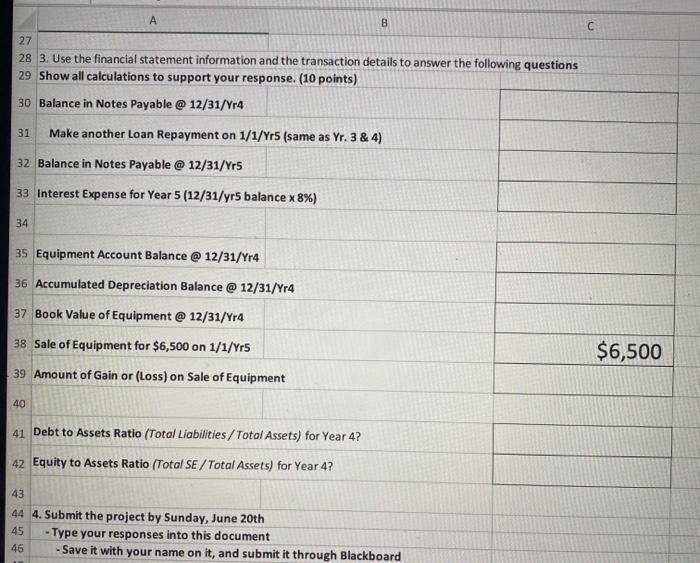
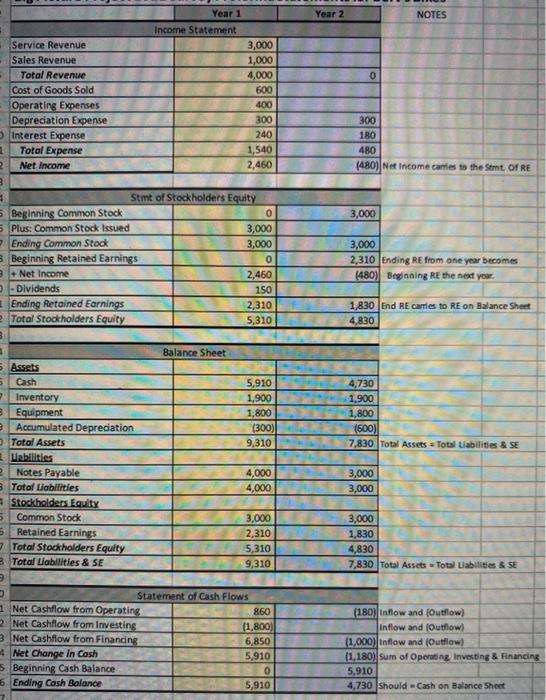
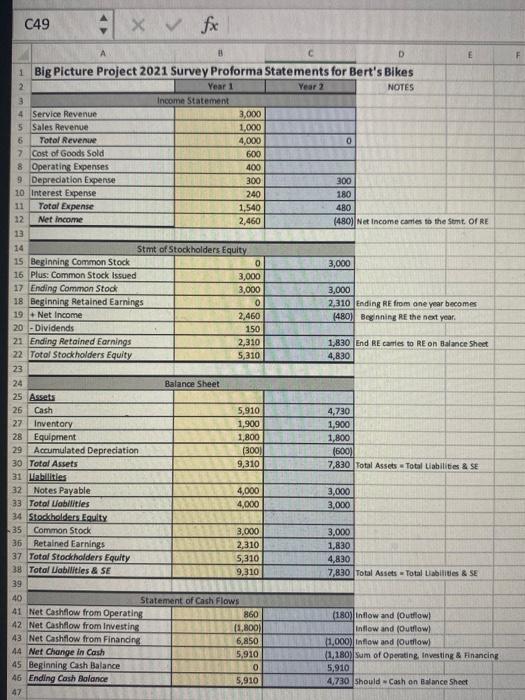
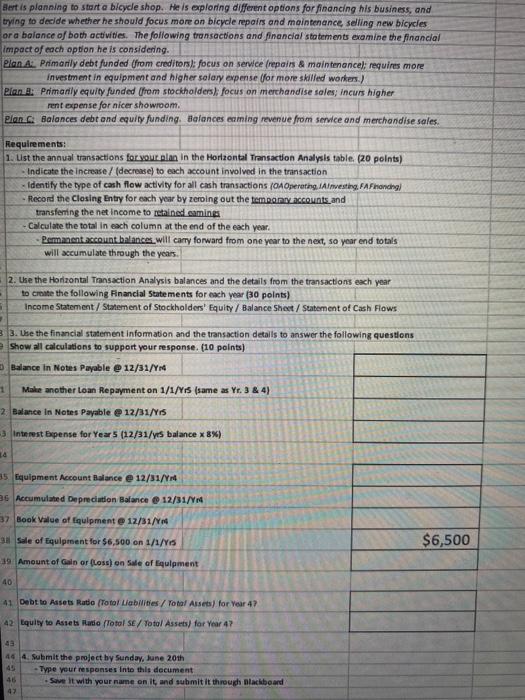
1 Big Picture Project Sample - ACCT2003 2021 21. Issue Stock for 3,000 3 2. Sien Note to borrow 4,000 6 4 3. Purchale Equipment for 1.800 Gyr. We, no salvage 5 4. Operating Expenses paid in cash 400 65. Revenues received in cash 3,000 76. Purchased Inventory for cash 2,500 8 7. Sold Inventory for 1,000; COGS 600 B. Interest Expense (4,000 X 6% 12/12) 9. Depreciation Expense (1,800/6) 10. Dividend paid (5% of Common Stock) Year 2 Transactions 1. Repay 1/4 of Note Payable 2. Record interest expense 3. Record Depreciation Expense Balance Sheet Liabilities 9 Income Statement 10 Assets Stockholders Equity Revenue Year 11 Trans - Expense Cash flow Cash Inventory Accumulated Depreciation Equipment Notes Payable Common Stock Retained Earnings Yeel 12 3,000 4,000 1,800 3,000 4,000 (1,800) (400) 3,000 (2,500) 1,000 (400) 3,000 400 2,500 13 1 FA 14 2 FA 15 IA 16 4 17 S OA 18 6 OA 19 7 20.7 21 8 OA 229 23 10 FA 24 Cosing 5 Total 3,000 (600) 1,000 (240) 600 1,000 (600) (240) (300) (150) 240 (300) (150) 300 5,910 1,900 1,800 (300) (1,540) 4,000 3,000 (4,000) 0 Tear 26 2,310 0 1,900 1,800 (300) 271 3,000 5,910 (1,000) (180) 4,000 (1,000) 2,310 0 FA 82 OA 93 O Closing 0 (300) (180) (300) 180 1 Total 4,730 1,900 0 1,800 (600) 300 (480) 0 2 3,000 3,000 1,830 3 4 5 Bikes Year 1 Year 2 NOTES Income Statement 0 4 Service Revenue S Sales Revenue 6 Total Revenue Cast of Goods Sold Operating Expenses 9 Deprecation Expense 0 Interest Expense 1 Total Expense 2 Net Income 3,000 1,000 4,000 600 400 300 240 1.540 2,460 300 180 480 (480) Net Income came to the Somt. Of RE 3 3.000 Stmt of Stockholders Equity s Beginning Common Stock o 6 Plus: Common Stock Issued 3.000 7 Ending Common Stock 3.000 Beginning Retained Earnings 0 Net Income 2,460 - Dividends 150 Ending Retained Earnings 2,310 Total Stockholders Equity 5,310 3,000 2,310inding RE from one year becomes (480) Beginning RE the next year 1.830 End RE care to Eon Balance Sheet 4,830 Balance Sheet Assets Cash 5,910 1,900 1.800 B00) 9,310 4.730 1.900 1,800 (600 7,830 Total Assets Total Liabilities & SE Inventory Equipment Accumulated Depreciation Total Assets Habilities Notes Payable Total Habilities Stockholders Equity Common Stock Retained Earnings Total Stockholders Equity Total abilities & SE 4,000 4,000 3,000 3,000 3,000 3.000 1.830 2,310 5,310 4,830 7.830 Total Assets - Total abilities & SE 9,310 Statement of Cash Flows Net Cashflow from Operating 860 Net Cashflow from Investing (1,800) Net Cashflow from Financing 6,850 Net Chonge in Cash 5,910 Beginning Cash Balance 0 Ending Cash Balance 5,910 (180) Inflow and (Outlow) Infow and (Outflow) (1.000) inflow and (Outflow 11.180) sum of Operating Investing & Financing 5.910 4,730 Should-Cash on Balance Sheet 32 Balance Sheet 33 Assets Income Statement Revenue - Expense Liabilities Stockholders Equity Accumulated Retained Year! 34 Trans flow Cash Inventory Equipment Depreciation Notes Payable Common Stock Earnings Year 0 0 0 0 0 0 0 0 0 35 36 3 37 3-2 38 3-2 39 1-2 40 3-3 41 34 42 34 43 34 44 3-5 45 Closind 46 Total 0 0 0 0 0 47 0 0 0 0 0 0 0 48 49 4-1 SO 4-2 51 42 52 4-2 53 4-3 54 44 55 4-4 56 44 57 45 58 Closing 59 Total 0 0 0 0 0 0 0 0 60 2 Year 1 Year 2 Year 3 Year 4 Years Income Statement 0 0 0 0 4 Service Revenue S Sales Revenue 6 Total Revenue 7 Cost of Goods Sold 8 Operating Expenses 9 Depreciation Expense 10 Interest Expense 11 Total Expense 12 Net Income 0 0 0 olo 0 0 0 13 14 Statement of Stockholders Equity 0 0 0 0 15 Beginning Common Stock 16 Plus: Common Stock Iss 17 Ending Common Stock 18 Beginning Retained Earings 19.Net Income 20 - Dividends 21 Ending Retained Earings 22 Total Stockholders Equity 23 0 0 0 0 0 0 olo 0 0 0 0 24 Balance Shep 0 0 0 0 25 Assets 26 Cash 27 Inventory 28 Equipment 29 Accumulated Depreciation 30 Total Assets 31 Liabilities 32 Notes Payable 33 Total abilities 34 Stockholders Equity 35 Common Stock 36 Retained Earnings 37 Total Stockholders Equity 38 Total Liabilities & SE 0 0 0 0 0 0 olo ol 0 39 0 40 Statement of Cash Flows 41 Net Cashflow from Operating 42 Net Cashflow from Investing 43 Net Cashflow from Financing 44 Net Change in Cash 45 Beginning Cash Balance 46 Ending Cash Balance 0 0 0 0 0 47 o 0 49 Transactions Plan B 3.1 Purchase Inventory for $40,000 cash Transactions Plan C 3-1 Purchase Inventory for $20,000 cash Transactions Plan A 50 -1 Purchase Inventory 51 or $3,700 cash 52 53 -2 Sales & Service Revenue 54 ervice Revenue $51,500 55 ales Rev $7,000; COGS $3,500 56 57 1-3 Debt Repayment@1/1/yr3 58 /4 of Original Note 3-2 Sales & Service Revenue Service Revenue $10,500 Sales Rev $67,700; COGS $33,800 3-2 Sales & Service Revenue Service Revenue $27,700 Sales Rev $31,600:COGS $15,800 3-3 Debt Repayment@1/1/yr3 1/4 of Original Note 3-3 Debt Repayment @1/1/yr3 1/4 of Original Note 59 60 4 Expenses 61 otal Operating Exp. $32,000 62 Depreciation Exp. equip, cost x 1/5 63 nterest Expenses 64 lote Pay. yr. end balance X8% 3-4 Expenses Total Operating Exp. $34,000 Depreciation Exp. equip. cost x1/5 Interest Expense- Note Pay yr. end balance x 8% 3-4 Expenses Total Operating Exp. $30,000 Depreciation Expequip. cost x 1/5 Interest Expense Note Pay yr. end balance X8% 65 66 1-5 Dividend Payment 67 common Stock x 10% 68 3-5 Dividend Payment Common Stock x 10% 3-5 Dividend Payment Common Stockx 10% 69 70 71 4-1 Purchase Inventory for $42,000 cash 4-1 Purchase Inventory for $24,000 cash ales & Service Revenue Service Revenue $12,000 Sales Rev $77,000; COGS $38,500 4-2 Sales & Service Revenue Service Revenue $31,800 Sales Rev $36,400;COGS $18,200 72 -1 Purchase Inventory 73 or $5,000 cash 74 75 -2 Sales & Service Revenue 76ervice Revenue $59,200 77 ales Rev $8,000; COGS $4,000 78 79 -3 Debt Repayment 1/1/yr4 80 /4 of Original Note 81 82 -4 Expenses 83 total Operating Exp. $24,000 84 Depreciation Exp. equip. costx 1/5 85hterest Expenses 86 lote Pay yr. end balance x8% 87 88 -5 Dividend Payment 89 Common Stock x 10% 4-3 Debt Repayment@1/17yr4 2/4 of Original Note 4-3 Debt Repayment @ 1/1/yra 1/4 of Original Note 4-4 Operating Expenses Total Operating Exp. $28,000 Depreciation Exp.-equip cost X1/5 Interest Expense Note Pay yr. end balance X8% 4-4 Operating Expenses Total Operating Exp. $26,000 Depreciation Exp. - equip. costx 1/5 Interest Expense Note Pay, yr end balance X8% 4-5 Dividend Payment Common Stock x 10% 4-5 Dividend Payment Common Stock x 10% B 27 28 3. Use the financial statement information and the transaction details to answer the following questions 29 Show all calculations to support your response. (10 points) 30 Balance in Notes Payable @ 12/31/Yr4 31 Make another Loan Repayment on 1/1/Yr5 (same as Yr. 3 & 4) 32 Balance in Notes Payable @ 12/31/Yr5 33 Interest Expense for Year 5 (12/31/yrs balance X8%) 34 35 Equipment Account Balance @ 12/31/Yr4 36 Accumulated Depreciation Balance @ 12/31/Yr4 37 Book Value of Equipment @ 12/31/Yr4 38 Sale of Equipment for $6,500 on 1/1/Yr5 $6,500 39 Amount of Gain or (Loss) on Sale of Equipment 40 41 Debt to Assets Ratio (Total Liabilities/Total Assets) for Year 4? 42 Equity to Assets Ratio (Total SE/Total Assets) for Year 4? 43 44 4. Submit the project by Sunday, June 20th 45 -Type your responses into this document - Save it with your name on it, and submit it through Blackboard 46 Year 1 Year 2 NOTES . 0 300 180 1 480 Net Income (480) Net Income carries to the Stmt. Of RE Income Statement Service Revenue 3,000 Sales Revenue 1,000 Total Revenue 4,000 Cost of Goods Sold 600 Operating Expenses 400 Depreciation Expense 300 Interest Expense 240 Total Expense 1,540 2. 2,460 3 Stmt of Stockholders Equity - Beginning Common Stock 0 Plus: Common Stock Issued 3,000 Ending Common Stock 3,000 Beginning Retained Earnings 0 + Net Income 2,460 - Dividends 150 Ending Retained Earnings 2,310 Total Stockholders Equity 5,310 3,000 3,000 2,310 Ending RE from one year becomes (480) Beginning RE the next year. 1,830 End RE carties to RE on Balance Sheet 4,830 Balance Sheet - Assets 6 Cash 5,910 1,900 1,800 4,730 1,900 1,800 (600) 7.830 Total Assets = Total Liabilities & SE (300) 9,310 Inventory 3 Equipment 3 Accumulated Depreciation Total Assets abilities Notes Payable B Total Liabilities Stockholders Equity 5. Common Stock 5 Retained Earnings Total Stockholders Equity 3 Total abilities & SE 4,000 4,000 3,000 3,000 3,000 2,310 5,310 9,310 3,000 1,830 4,830 7,830 Total Assets Total abilities & SE 3 860 Statement of Cash Flows 1 Net Cashflow from Operating Net Cashflow from Investing (1,800) 3 Net Cashflow from Financing 6,850 4 Net Change in Cash 5,910 5. Beginning Cash Balance 0 6 Ending Cash Balance 5,910 (180) Inflow and (Outflow) inflow and (Outflow) (1.000) Inflow and (Outflow) (1.180) Sum of Operating Investing & Financing 5,910 4.730 Should Cash on Balance Sheet C49 x x D E F 1 Big Picture Project 2021 Survey Proforma Statements for Bert's Bikes 2 Year 1 Year 2 NOTES Income Statement 3,000 1,000 4,000 600 0 3 4 Service Revenue 5 Sales Revenue 6 Total Revenue 7 Cost of Goods Sold 8 Operating Expenses 9 Depreciation Expense 10 Interest Expense 11 Total Expense 12 Net Income 400 300 300 240 180 1,540 2,460 480 (480) Net Income comes to the Smt. Of RE 13 3,000 3,000 14 Stmt of Stockholders Equity 15 Beginning Common Stock 0 16 Plus: Common Stock Issued 3,000 17 Ending Common Stock 18 Beginning Retained Earnings 0 19 Net Income 2,460 20 - Dividends 150 21 Ending Retained Earnings 2,310 22 Total Stockholders Equity 5,310 3,000 2,310 Ending RE from one year becomes (480) Beginning RE the next year. 1,830 End RE carries to RE on Balance Sheet 4,830 23 24 Balance Sheet 4,730 1,900 5,910 1,900 1,800 (300 9,310 1,800 1600) 7,830 Total Assets Total Liabilities & SE 25 Assets 26 Cash 27 Inventory 28 Equipment 29 Accumulated Depreciation 30 Total Assets 31 Habilities 32 Notes Payable 33 Total abilities 34 Stockholders Equity 35 Common Stock 36 Retained Earnings 37 Total Stockholders Equity 38 Total abilities & SE 39 4,000 4,000 3,000 3,000 3.000 2,310 5,310 9,310 3,000 1,830 4,830 7,830 Total Assets - Total Liabilities & SE 40 Statement of Cash Flows 41 Net Cashflow from Operating 860 42 Net Cashflow from Investing (1,8001 43 Net Cashflow from Financing 6,850 44 Net Change in Cash 5,910 45 Beginning Cash Balance 46 Ending Cash Balance 5,910 (180) Inflow and (Outflow) Inflow and (Outflow) 1,000) Inflow and (Outllow) (1,180) Sum of Operating Investing & Financing 5,910 4.730 Should Cash on Balance Sheet O 47 Bert is planning to start a bicycle shop. He is exploring different options for financing his business, and trying to decide whether he should focus more on bicycle repairs and maintenance selling new bicycles or a balance of both activities. The following transactions and financial statements examine the financial impact of each option he is considering. Plan Ai. Primarily debt funded from creditors focus on service repairs & maintenance); requires more investment in equipment and higher salary expense for more skilled workers.) Plan B Primarily equity funded from stockholders) focus on merchandise sales, incurs higher rent expense for nicer showroom. Plan Balances debt and equity funding, Balances caming revenue from service and merchandise sales Requirements: 1. List the annual transactions for your plan in the Horizontal Transaction Analysis table. (20 points) Indicate the increase / (decrease) to each account involved in the transaction - Identity the type of cash flow activity for all cash transactions (OA Operating Alnvesting. FAF handig) Record the closing Entry for each year by zeroing out the tempont accounts and transferring the net income to retained caming Calculate the total in each column at the end of the each year. - Permanent account balances will carry forward from one year to the next, so year end totals will accumulate through the years . 2. Use the Horizontal Transaction Analysis balances and the details from the transactions each year to create the following Financial Statements for each year (30 points) Income Statement / Statement of Stockholders' Equity / Balance Sheet / Statement of Cash Flows 3.3. Use the financial statement information and the transaction details to answer the following questions Show all calculations to support your response. (10 points) Balance in Notes Payable @ 12/31/94 Make another Loan Repayment on 1/1/15 (same as Yr. 3 & 4) 2. Balance in Notes Payable @ 12/01/15 Interest Expense for Years (12/31/yts balance x 8%) 1 35 Equipment Account Balance e 12/31/4 B. Accumulated Depreciation Balance 12/31/ 37 Book Value of liquipment @ 12/31/14 a sale of Equipment for $6,500 on 1/1/15 19 Amount of Gain or loss) on Sale of Equipment $6,500 40 41 Debt to Assets Ratio (Totol Liabilities/Total Assets) for Year 47 42 Equity to Assets Ratio (Total SE/Total Assets for Year 47 49 44. 4. Submit the project by Sunday, June 20th Type your responses into this document Save it with your name on it and submit it through Blackboard 46 42 1 Big Picture Project Sample - ACCT2003 2021 21. Issue Stock for 3,000 3 2. Sien Note to borrow 4,000 6 4 3. Purchale Equipment for 1.800 Gyr. We, no salvage 5 4. Operating Expenses paid in cash 400 65. Revenues received in cash 3,000 76. Purchased Inventory for cash 2,500 8 7. Sold Inventory for 1,000; COGS 600 B. Interest Expense (4,000 X 6% 12/12) 9. Depreciation Expense (1,800/6) 10. Dividend paid (5% of Common Stock) Year 2 Transactions 1. Repay 1/4 of Note Payable 2. Record interest expense 3. Record Depreciation Expense Balance Sheet Liabilities 9 Income Statement 10 Assets Stockholders Equity Revenue Year 11 Trans - Expense Cash flow Cash Inventory Accumulated Depreciation Equipment Notes Payable Common Stock Retained Earnings Yeel 12 3,000 4,000 1,800 3,000 4,000 (1,800) (400) 3,000 (2,500) 1,000 (400) 3,000 400 2,500 13 1 FA 14 2 FA 15 IA 16 4 17 S OA 18 6 OA 19 7 20.7 21 8 OA 229 23 10 FA 24 Cosing 5 Total 3,000 (600) 1,000 (240) 600 1,000 (600) (240) (300) (150) 240 (300) (150) 300 5,910 1,900 1,800 (300) (1,540) 4,000 3,000 (4,000) 0 Tear 26 2,310 0 1,900 1,800 (300) 271 3,000 5,910 (1,000) (180) 4,000 (1,000) 2,310 0 FA 82 OA 93 O Closing 0 (300) (180) (300) 180 1 Total 4,730 1,900 0 1,800 (600) 300 (480) 0 2 3,000 3,000 1,830 3 4 5 Bikes Year 1 Year 2 NOTES Income Statement 0 4 Service Revenue S Sales Revenue 6 Total Revenue Cast of Goods Sold Operating Expenses 9 Deprecation Expense 0 Interest Expense 1 Total Expense 2 Net Income 3,000 1,000 4,000 600 400 300 240 1.540 2,460 300 180 480 (480) Net Income came to the Somt. Of RE 3 3.000 Stmt of Stockholders Equity s Beginning Common Stock o 6 Plus: Common Stock Issued 3.000 7 Ending Common Stock 3.000 Beginning Retained Earnings 0 Net Income 2,460 - Dividends 150 Ending Retained Earnings 2,310 Total Stockholders Equity 5,310 3,000 2,310inding RE from one year becomes (480) Beginning RE the next year 1.830 End RE care to Eon Balance Sheet 4,830 Balance Sheet Assets Cash 5,910 1,900 1.800 B00) 9,310 4.730 1.900 1,800 (600 7,830 Total Assets Total Liabilities & SE Inventory Equipment Accumulated Depreciation Total Assets Habilities Notes Payable Total Habilities Stockholders Equity Common Stock Retained Earnings Total Stockholders Equity Total abilities & SE 4,000 4,000 3,000 3,000 3,000 3.000 1.830 2,310 5,310 4,830 7.830 Total Assets - Total abilities & SE 9,310 Statement of Cash Flows Net Cashflow from Operating 860 Net Cashflow from Investing (1,800) Net Cashflow from Financing 6,850 Net Chonge in Cash 5,910 Beginning Cash Balance 0 Ending Cash Balance 5,910 (180) Inflow and (Outlow) Infow and (Outflow) (1.000) inflow and (Outflow 11.180) sum of Operating Investing & Financing 5.910 4,730 Should-Cash on Balance Sheet 32 Balance Sheet 33 Assets Income Statement Revenue - Expense Liabilities Stockholders Equity Accumulated Retained Year! 34 Trans flow Cash Inventory Equipment Depreciation Notes Payable Common Stock Earnings Year 0 0 0 0 0 0 0 0 0 35 36 3 37 3-2 38 3-2 39 1-2 40 3-3 41 34 42 34 43 34 44 3-5 45 Closind 46 Total 0 0 0 0 0 47 0 0 0 0 0 0 0 48 49 4-1 SO 4-2 51 42 52 4-2 53 4-3 54 44 55 4-4 56 44 57 45 58 Closing 59 Total 0 0 0 0 0 0 0 0 60 2 Year 1 Year 2 Year 3 Year 4 Years Income Statement 0 0 0 0 4 Service Revenue S Sales Revenue 6 Total Revenue 7 Cost of Goods Sold 8 Operating Expenses 9 Depreciation Expense 10 Interest Expense 11 Total Expense 12 Net Income 0 0 0 olo 0 0 0 13 14 Statement of Stockholders Equity 0 0 0 0 15 Beginning Common Stock 16 Plus: Common Stock Iss 17 Ending Common Stock 18 Beginning Retained Earings 19.Net Income 20 - Dividends 21 Ending Retained Earings 22 Total Stockholders Equity 23 0 0 0 0 0 0 olo 0 0 0 0 24 Balance Shep 0 0 0 0 25 Assets 26 Cash 27 Inventory 28 Equipment 29 Accumulated Depreciation 30 Total Assets 31 Liabilities 32 Notes Payable 33 Total abilities 34 Stockholders Equity 35 Common Stock 36 Retained Earnings 37 Total Stockholders Equity 38 Total Liabilities & SE 0 0 0 0 0 0 olo ol 0 39 0 40 Statement of Cash Flows 41 Net Cashflow from Operating 42 Net Cashflow from Investing 43 Net Cashflow from Financing 44 Net Change in Cash 45 Beginning Cash Balance 46 Ending Cash Balance 0 0 0 0 0 47 o 0 49 Transactions Plan B 3.1 Purchase Inventory for $40,000 cash Transactions Plan C 3-1 Purchase Inventory for $20,000 cash Transactions Plan A 50 -1 Purchase Inventory 51 or $3,700 cash 52 53 -2 Sales & Service Revenue 54 ervice Revenue $51,500 55 ales Rev $7,000; COGS $3,500 56 57 1-3 Debt Repayment@1/1/yr3 58 /4 of Original Note 3-2 Sales & Service Revenue Service Revenue $10,500 Sales Rev $67,700; COGS $33,800 3-2 Sales & Service Revenue Service Revenue $27,700 Sales Rev $31,600:COGS $15,800 3-3 Debt Repayment@1/1/yr3 1/4 of Original Note 3-3 Debt Repayment @1/1/yr3 1/4 of Original Note 59 60 4 Expenses 61 otal Operating Exp. $32,000 62 Depreciation Exp. equip, cost x 1/5 63 nterest Expenses 64 lote Pay. yr. end balance X8% 3-4 Expenses Total Operating Exp. $34,000 Depreciation Exp. equip. cost x1/5 Interest Expense- Note Pay yr. end balance x 8% 3-4 Expenses Total Operating Exp. $30,000 Depreciation Expequip. cost x 1/5 Interest Expense Note Pay yr. end balance X8% 65 66 1-5 Dividend Payment 67 common Stock x 10% 68 3-5 Dividend Payment Common Stock x 10% 3-5 Dividend Payment Common Stockx 10% 69 70 71 4-1 Purchase Inventory for $42,000 cash 4-1 Purchase Inventory for $24,000 cash ales & Service Revenue Service Revenue $12,000 Sales Rev $77,000; COGS $38,500 4-2 Sales & Service Revenue Service Revenue $31,800 Sales Rev $36,400;COGS $18,200 72 -1 Purchase Inventory 73 or $5,000 cash 74 75 -2 Sales & Service Revenue 76ervice Revenue $59,200 77 ales Rev $8,000; COGS $4,000 78 79 -3 Debt Repayment 1/1/yr4 80 /4 of Original Note 81 82 -4 Expenses 83 total Operating Exp. $24,000 84 Depreciation Exp. equip. costx 1/5 85hterest Expenses 86 lote Pay yr. end balance x8% 87 88 -5 Dividend Payment 89 Common Stock x 10% 4-3 Debt Repayment@1/17yr4 2/4 of Original Note 4-3 Debt Repayment @ 1/1/yra 1/4 of Original Note 4-4 Operating Expenses Total Operating Exp. $28,000 Depreciation Exp.-equip cost X1/5 Interest Expense Note Pay yr. end balance X8% 4-4 Operating Expenses Total Operating Exp. $26,000 Depreciation Exp. - equip. costx 1/5 Interest Expense Note Pay, yr end balance X8% 4-5 Dividend Payment Common Stock x 10% 4-5 Dividend Payment Common Stock x 10% B 27 28 3. Use the financial statement information and the transaction details to answer the following questions 29 Show all calculations to support your response. (10 points) 30 Balance in Notes Payable @ 12/31/Yr4 31 Make another Loan Repayment on 1/1/Yr5 (same as Yr. 3 & 4) 32 Balance in Notes Payable @ 12/31/Yr5 33 Interest Expense for Year 5 (12/31/yrs balance X8%) 34 35 Equipment Account Balance @ 12/31/Yr4 36 Accumulated Depreciation Balance @ 12/31/Yr4 37 Book Value of Equipment @ 12/31/Yr4 38 Sale of Equipment for $6,500 on 1/1/Yr5 $6,500 39 Amount of Gain or (Loss) on Sale of Equipment 40 41 Debt to Assets Ratio (Total Liabilities/Total Assets) for Year 4? 42 Equity to Assets Ratio (Total SE/Total Assets) for Year 4? 43 44 4. Submit the project by Sunday, June 20th 45 -Type your responses into this document - Save it with your name on it, and submit it through Blackboard 46 Year 1 Year 2 NOTES . 0 300 180 1 480 Net Income (480) Net Income carries to the Stmt. Of RE Income Statement Service Revenue 3,000 Sales Revenue 1,000 Total Revenue 4,000 Cost of Goods Sold 600 Operating Expenses 400 Depreciation Expense 300 Interest Expense 240 Total Expense 1,540 2. 2,460 3 Stmt of Stockholders Equity - Beginning Common Stock 0 Plus: Common Stock Issued 3,000 Ending Common Stock 3,000 Beginning Retained Earnings 0 + Net Income 2,460 - Dividends 150 Ending Retained Earnings 2,310 Total Stockholders Equity 5,310 3,000 3,000 2,310 Ending RE from one year becomes (480) Beginning RE the next year. 1,830 End RE carties to RE on Balance Sheet 4,830 Balance Sheet - Assets 6 Cash 5,910 1,900 1,800 4,730 1,900 1,800 (600) 7.830 Total Assets = Total Liabilities & SE (300) 9,310 Inventory 3 Equipment 3 Accumulated Depreciation Total Assets abilities Notes Payable B Total Liabilities Stockholders Equity 5. Common Stock 5 Retained Earnings Total Stockholders Equity 3 Total abilities & SE 4,000 4,000 3,000 3,000 3,000 2,310 5,310 9,310 3,000 1,830 4,830 7,830 Total Assets Total abilities & SE 3 860 Statement of Cash Flows 1 Net Cashflow from Operating Net Cashflow from Investing (1,800) 3 Net Cashflow from Financing 6,850 4 Net Change in Cash 5,910 5. Beginning Cash Balance 0 6 Ending Cash Balance 5,910 (180) Inflow and (Outflow) inflow and (Outflow) (1.000) Inflow and (Outflow) (1.180) Sum of Operating Investing & Financing 5,910 4.730 Should Cash on Balance Sheet C49 x x D E F 1 Big Picture Project 2021 Survey Proforma Statements for Bert's Bikes 2 Year 1 Year 2 NOTES Income Statement 3,000 1,000 4,000 600 0 3 4 Service Revenue 5 Sales Revenue 6 Total Revenue 7 Cost of Goods Sold 8 Operating Expenses 9 Depreciation Expense 10 Interest Expense 11 Total Expense 12 Net Income 400 300 300 240 180 1,540 2,460 480 (480) Net Income comes to the Smt. Of RE 13 3,000 3,000 14 Stmt of Stockholders Equity 15 Beginning Common Stock 0 16 Plus: Common Stock Issued 3,000 17 Ending Common Stock 18 Beginning Retained Earnings 0 19 Net Income 2,460 20 - Dividends 150 21 Ending Retained Earnings 2,310 22 Total Stockholders Equity 5,310 3,000 2,310 Ending RE from one year becomes (480) Beginning RE the next year. 1,830 End RE carries to RE on Balance Sheet 4,830 23 24 Balance Sheet 4,730 1,900 5,910 1,900 1,800 (300 9,310 1,800 1600) 7,830 Total Assets Total Liabilities & SE 25 Assets 26 Cash 27 Inventory 28 Equipment 29 Accumulated Depreciation 30 Total Assets 31 Habilities 32 Notes Payable 33 Total abilities 34 Stockholders Equity 35 Common Stock 36 Retained Earnings 37 Total Stockholders Equity 38 Total abilities & SE 39 4,000 4,000 3,000 3,000 3.000 2,310 5,310 9,310 3,000 1,830 4,830 7,830 Total Assets - Total Liabilities & SE 40 Statement of Cash Flows 41 Net Cashflow from Operating 860 42 Net Cashflow from Investing (1,8001 43 Net Cashflow from Financing 6,850 44 Net Change in Cash 5,910 45 Beginning Cash Balance 46 Ending Cash Balance 5,910 (180) Inflow and (Outflow) Inflow and (Outflow) 1,000) Inflow and (Outllow) (1,180) Sum of Operating Investing & Financing 5,910 4.730 Should Cash on Balance Sheet O 47 Bert is planning to start a bicycle shop. He is exploring different options for financing his business, and trying to decide whether he should focus more on bicycle repairs and maintenance selling new bicycles or a balance of both activities. The following transactions and financial statements examine the financial impact of each option he is considering. Plan Ai. Primarily debt funded from creditors focus on service repairs & maintenance); requires more investment in equipment and higher salary expense for more skilled workers.) Plan B Primarily equity funded from stockholders) focus on merchandise sales, incurs higher rent expense for nicer showroom. Plan Balances debt and equity funding, Balances caming revenue from service and merchandise sales Requirements: 1. List the annual transactions for your plan in the Horizontal Transaction Analysis table. (20 points) Indicate the increase / (decrease) to each account involved in the transaction - Identity the type of cash flow activity for all cash transactions (OA Operating Alnvesting. FAF handig) Record the closing Entry for each year by zeroing out the tempont accounts and transferring the net income to retained caming Calculate the total in each column at the end of the each year. - Permanent account balances will carry forward from one year to the next, so year end totals will accumulate through the years . 2. Use the Horizontal Transaction Analysis balances and the details from the transactions each year to create the following Financial Statements for each year (30 points) Income Statement / Statement of Stockholders' Equity / Balance Sheet / Statement of Cash Flows 3.3. Use the financial statement information and the transaction details to answer the following questions Show all calculations to support your response. (10 points) Balance in Notes Payable @ 12/31/94 Make another Loan Repayment on 1/1/15 (same as Yr. 3 & 4) 2. Balance in Notes Payable @ 12/01/15 Interest Expense for Years (12/31/yts balance x 8%) 1 35 Equipment Account Balance e 12/31/4 B. Accumulated Depreciation Balance 12/31/ 37 Book Value of liquipment @ 12/31/14 a sale of Equipment for $6,500 on 1/1/15 19 Amount of Gain or loss) on Sale of Equipment $6,500 40 41 Debt to Assets Ratio (Totol Liabilities/Total Assets) for Year 47 42 Equity to Assets Ratio (Total SE/Total Assets for Year 47 49 44. 4. Submit the project by Sunday, June 20th Type your responses into this document Save it with your name on it and submit it through Blackboard 46 42
Step by Step Solution
There are 3 Steps involved in it

Get step-by-step solutions from verified subject matter experts