

Question: 1. Binomial distribution (Ch 5) Use Excel to calculate the following probability; Use TI calculator to check your results (a) X ~ Bin(n=10, p=.70); use
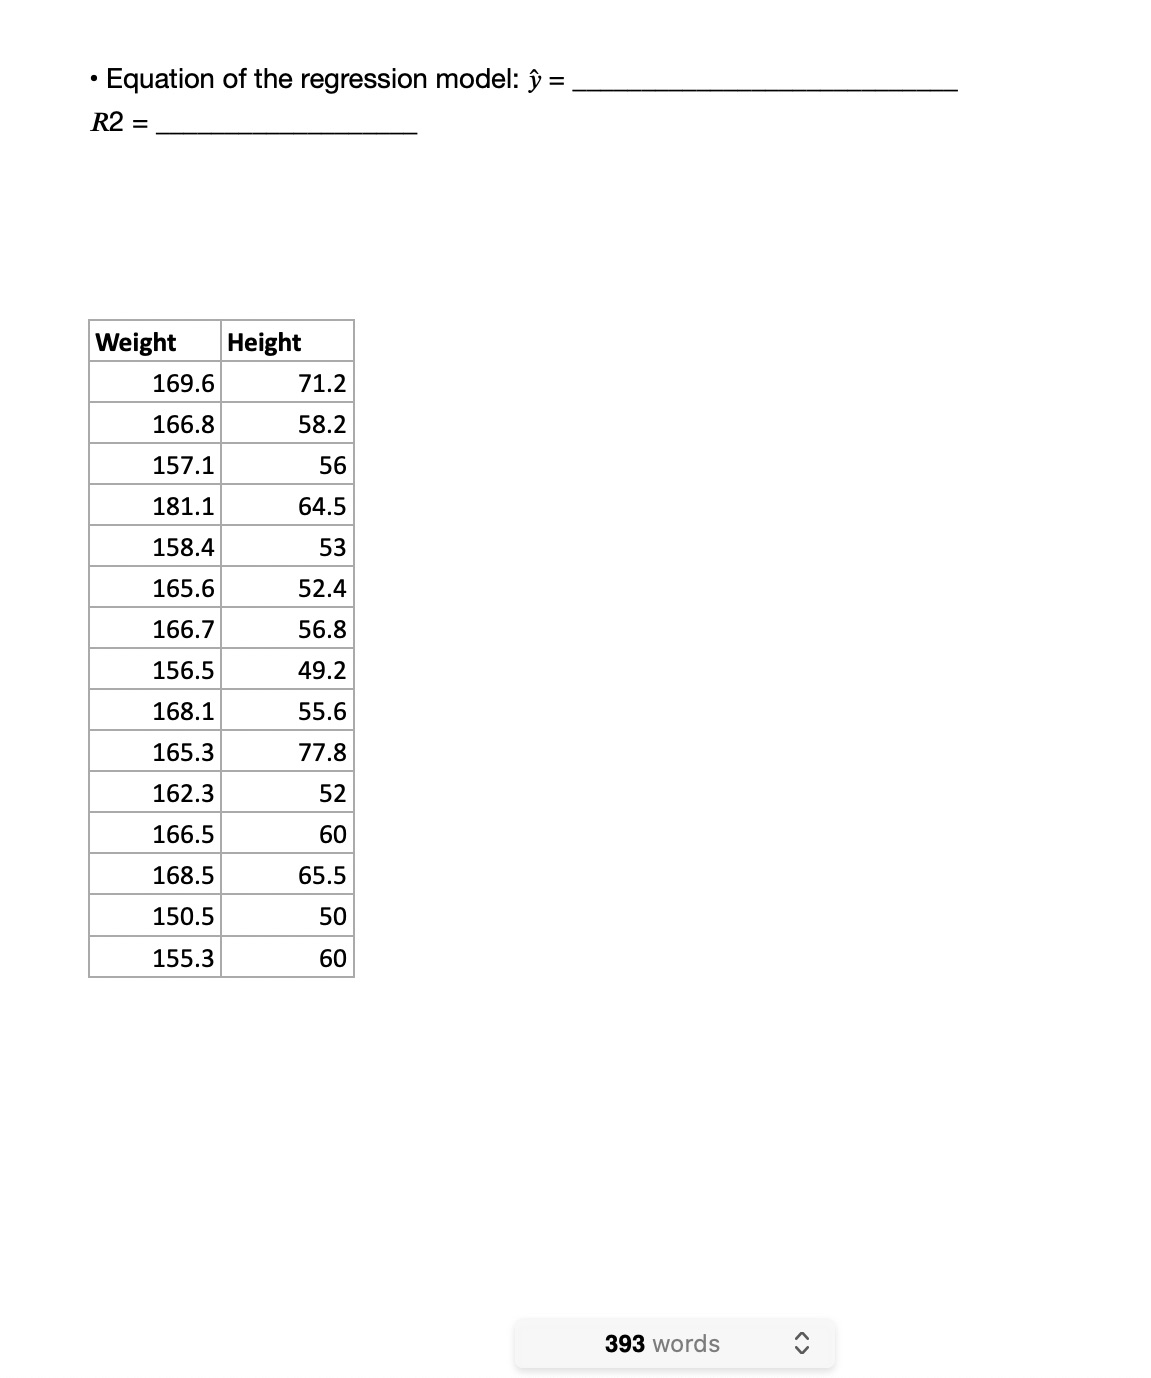
1. Binomial distribution (Ch 5) Use Excel to calculate the following probability; Use TI calculator to check your results (a) X ~ Bin(n=10, p=.70); use BINOM.DISTO b) X ~ Bin(n=10, p=.30) Plot a histogram of each. Save your work in Sheet 1 2. Build a histogram (Ch 6)(A random sample histogram to explore the distribution of the population) Use the command below to create 100 random numbers from a population. (a) 100 Random numbers from Standard Normal(mu=0, sigma=1) population =NORM.INV(RAND(), 0, 1) Plot a histogram. What are your remarks? Any remark about the population. b) 100 random numbers from a Normal(mu=5, Stddev=2) population =NORM.INV(RAND(, 5, 2) Plot a histogram. What are your remarks? Any remark about the population. (c) 100 random from a F-distribution , df1=5, df2=10, population. =F.INV(RAND(), 5, 10) Plot a histogram. What are your remarks? Any conclusion about the population. Save your work in Sheet 2 3. Study of sample Xbar (Ch 7) (Create samples to study the properties of Xbar) (a) Create 20 to 25 random samples, size =30, from a Normal population N(mu=4, sd=2), using =NORM.INV(RAND(), 4, 2) (b) Calculate the means of each sample (Xbar). Note: Xbar is a variable (c) Plot a histogram of the 20(or 25) sample averages Xbar's. Remarks? d) Calculate mu(Xbar); sd(Xbar) 4. REGRESSION MODEL (Ch 12) Answer inside the EXCEL file Open file: Height-Weight.xIsx. (a) Draw a scatterplot of Weight on the vertical , versus Height on the horizontal. Notice any pattern. (b) Read from ANOV A output. . Coefficient of determination : . From the ANOVA output: SSR df. ; SSE df_ SST df_ F-test: NULLL ; ALTERNATE F-stat P.=value: Conclussion . From the Coefficients output Test on y-intercept: Ho ; Ha BO = t-stat P-value. Conclusion: Test on Slope: Ho Ha 95%- Cl for BO: B1 = t-stat P-value. Conclusion: 95%- Cl for B1: ( 393 words\f
Step by Step Solution
There are 3 Steps involved in it

Get step-by-step solutions from verified subject matter experts