

Question: Bonus Activity Math 250 A B C D E F G H K L M N O P Q R BONUS Activity-MATH 250 Elements of
Bonus Activity Math 250
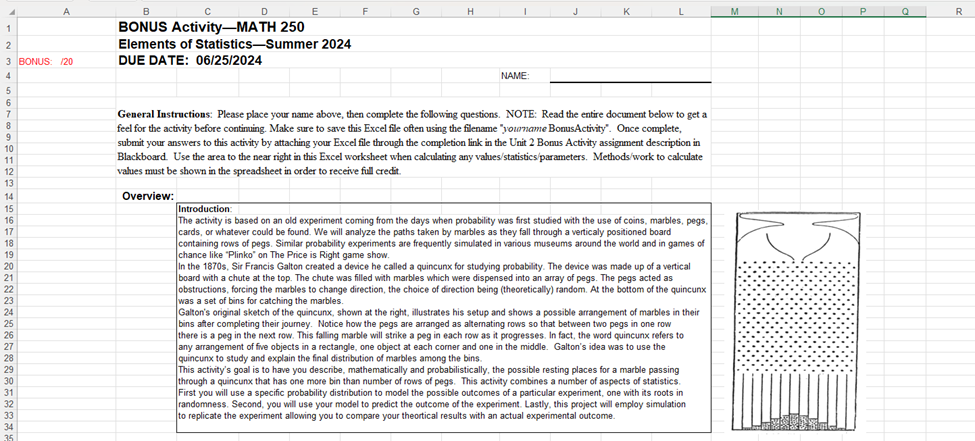
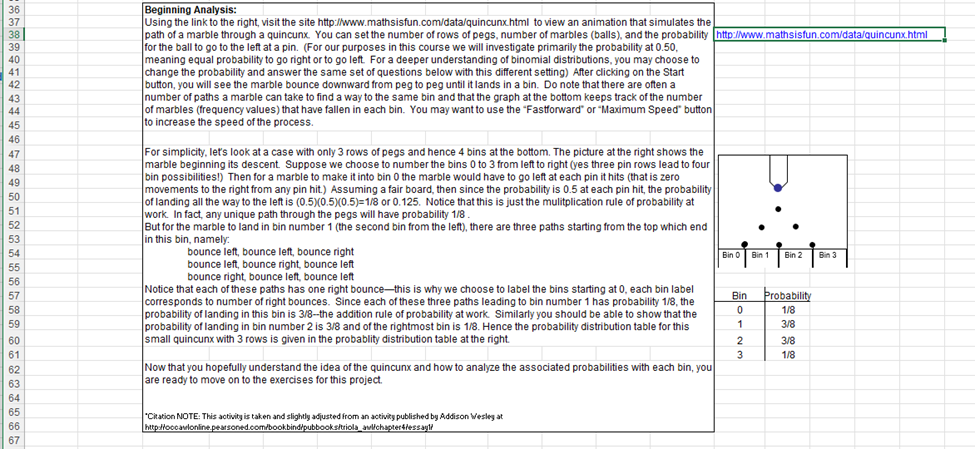
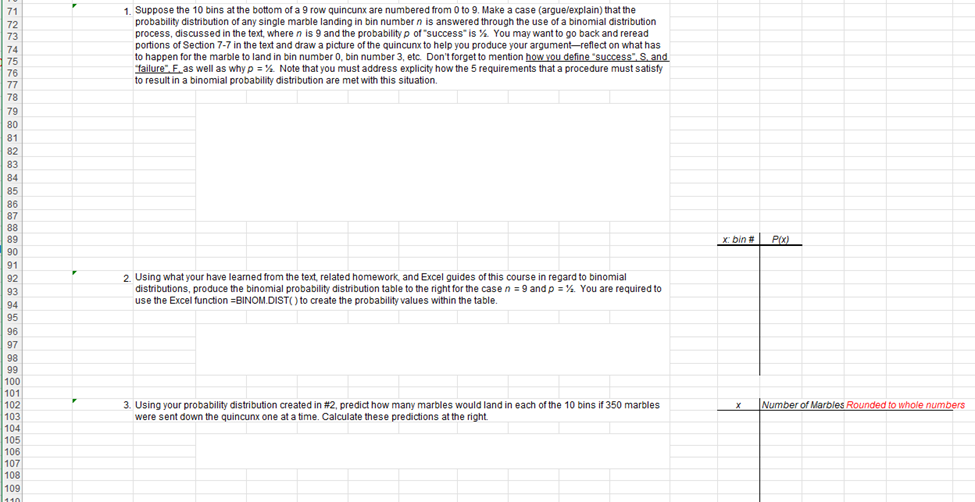
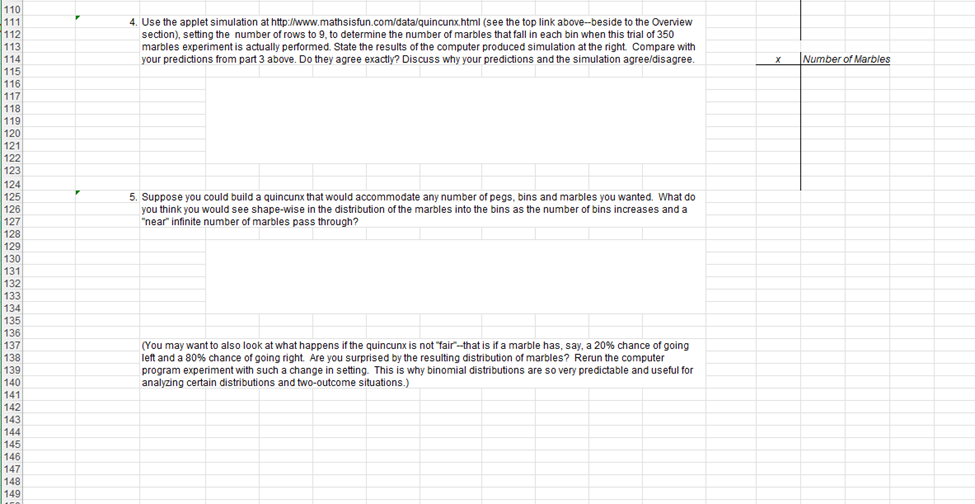
A B C D E F G H K L M N O P Q R BONUS Activity-MATH 250 Elements of Statistics-Summer 2024 BONUS: /20 DUE DATE: 06/25/2024 NAME: General Instructions: Please place your name above, then complete the following questions. NOTE: Read the entire document below to get a feel for the activity before continuing. Make sure to save this Excel file often using the filename "yourname BonusActivity". Once complete, submit your answers to this activity by attaching your Excel file through the completion link in the Unit 2 Bonus Activity assignment description in Blackboard. Use the area to the near right in this Excel worksheet when calculating any values/statistics parameters, Methods/work to calculate values must be shown in the spreadsheet in order to receive full credit Overview: Introduction: The activity is based on an old experiment coming from the days when probability was first studied with the use of coins, marbles, pegs, cards, or whatever could be found. We will analyze the paths taken by marbles as they fall through a verticaly positioned board containing rows of pegs. Similar probability experiments are frequently simulated in various museums around the world and in games of chance like "Plinko" on The Price is Right game show. In the 1870s, Sir Francis Galton created a device he called a quincunx for studying probability. The device was made up of a vertical board with a chute at the top. The chute was filled with marbles which were dispensed into an array of pegs. The pegs acted as obstructions, forcing the marbles to change direction, the choice of direction being (theoretically) random. At the bottom of the quincunx 23 was a set of bins for catching the marbles. 24 Galton's original sketch of the quincunx, shown at the right, illustrates his setup and shows a possible arrangement of marbles in their bins after completing their journey. Notice how the pegs are arranged as alternating rows so that between two pegs in one row there is a peg in the next row. This falling marble will strike a peg in each row as it progresses. In fact, the word quincunx refers to any arrangement of five objects in a rectangle, one object at each corner and one in the middle. Galton's idea was to use the quincunx to study and explain the final distribution of marbles among the bins. 29 This activity's goal is to have you describe, mathematically and probabilistically, the possible resting places for a marble passing 30 through a quincunx that has one more bin than number of rows of pegs. This activity combines a number of aspects of statistics. 31 First you will use a specific probability distribution to model the possible outcomes of a particular experiment, one with its roots in 32 randomness. Second, you will use your model to predict the outcome of the experiment. Lastly, this project will employ simulation 33 to replicate the experiment allowing you to compare your theortical results with an actual experimental outcome. 34 a7 39| 40| 41 43| 45 | 46 | 47 | 48 | 49| 50 | 51| 52| 53 | 55 | 56| 57| 59 | 60 | 61| 53| 64| 85| 66 | 67| Beginning Analysis: Using the link to the right, visit the site http:'www.mathsisfun.com/data/quincunx html to view an animation that simulates the path of a marble through a quincunx. You can setthe number of rows of pegs, number of marbles (balls), and the probability | hitp:iwww. mathsistun.com/data/guincun html for the ball to go to the left at a pin. (For our purposes in this course we will investigate primarily the probability at 0.50, meaning equal probability to go right or to go left. For a deeper understanding of binomial distributions, you may choose to change the probability and answer the same set of questions below with this different seting) After clicking on the Start button, you will see the marble bounce downward from peg to peg until it lands in a bin. Do note that there are often a number of paths a marble can take to find a way to the same bin and that the graph at the bottom keeps track of the number of marbles (frequency values) that have fallen in each bin. You may want to use the \"Fastforward\" or \"Maximum Speed\" bution to increase the speed of the process. For simplicity, let's look at a case with only 3 rows of pegs and hence 4 bins atthe bottom, The picture at the right shows the marble beginning its descent Suppose we choose to number the bins 0 to 3 from left to right (yes three pin rows lead to four bin possibilities!) Then for a marble to make itinto bin 0 the marble would have to go left at each pin it hits (that is zero maovements to the right from any pin hit) Assuming a fair board, then since the probability is 0.5 at each pin hit, the probability of landing all the way 1o the left is (0.540.540.5)="1/& or 0.125. Notice that this is just the mulitplication rule of probability at work. Infact, any unigue path through the pegs will have probability 1/8 . But for the marble to land in bin number 1 (the second bin from the left), there are three paths starting from the top which end in this bin, namely: bounce left, bounce left, bounce right bounce left, bounce right. bounce left bounce right, bounce left, bounce left Motice that each of these paths has one right bouncethis is why we choose to label the bins starting at 0, each bin label corresponds to number of right bounces. Since each of these three paths leading to bin number 1 has probability 1/8, the probability of landing in this bin is 3/8-the addition rule of probability at work. Similarly you should be able to show thatthe probability of landing in bin number 2 is 3/3 and of the rightmast bin is 1/8. Hence the probability distribution table for this small quincunx with 3 rows is given in the probablity distribution table atthe right Mow that you hopefully understand the idea of the quincunx and how to analyze the associated probabilities with each bin, you are ready to move on 1o the exercises for this project. *Citation NOTE: Thiz activityis taken and slightly adjusted from an activity publizhed by Addison Wesley at o swlonbine pe st soned comibookbi diess. BinD | Bin1 Bin2 Bn3 1. Suppose the 10 bins at the bottom of a 9 row quincunx are numbered from 0 to 9. Make a case (argue/explain) that the probability distribution of any single marble landing in bin number n is answered through the use of a binomial distribution 71 process, discussed in the text, where n is 9 and the probability p of "success" is %%. You may want to go back and reread 72 portions of Section 7-7 in the text and draw a picture of the quincunx to help you produce your argument-reflect on what has 73 to happen for the marble to land in bin number 0, bin number 3, etc. Don't forget to mention how you define "success" S, and 74 "failure". F. as well as why p = %%. Note that you must address explicity how the 5 requirements that a procedure must satisfy 75 to result in a binomial probability distribution are met with this situation. 76 77 78 79 80 81 82 83 84 85 86 x bin # Pix) 87 88 89 90 2. Using what your have learned from the text, related homework, and Excel guides of this course in regard to binomial 91 distributions, produce the binomial probability distribution table to the right for the case n = 9 and p = %%. You are required to 92 93 use the Excel function =BINOM.DIST( ) to create the probability values within the table. 94 95 96 97 98 * Number of Marbles Rounded to whole numbers 99 100 3. Using your probability distribution created in #2, predict how many marbles would land in each of the 10 bins if 350 marbles 101 102 were sent down the quincunx one at a time. Calculate these predictions at the right. 103 104 105 106 107 108 109110 111 4. Use the applet simulation at http://www.mathsisfun.com/data/quincunx.html (see the top link above-beside to the Overview 112 section), setting the number of rows to 9, to determine the number of marbles that fall in each bin when this trial of 350 113 marbles experiment is actually performed. State the results of the computer produced simulation at the right Compare with 114 your predictions from part 3 above. Do they agree exactly? Discuss why your predictions and the simulation agree/disagree. * Number of Marbles 115 116 117 118 119 120 121 122 123 124 125 5. Suppose you could build a quincunx that would accommodate any number of pegs, bins and marbles you wanted. What do 126 you think you would see shape-wise in the distribution of the marbles into the bins as the number of bins increases and a 127 "near" infinite number of marbles pass through? 128 129 130 131 132 133 134 135 136 137 (You may want to also look at what happens if the quincunx is not "fair"-that is if a marble has, say, a 20% chance of going 138 left and a 80% chance of going right. Are you surprised by the resulting distribution of marbles? Rerun the computer 139 program experiment with such a change in setting. This is why binomial distributions are so very predictable and useful for 140 analyzing certain distributions and two-outcome situations.) 141 142 143 144 145 146 147 148 149
Step by Step Solution
There are 3 Steps involved in it

Get step-by-step solutions from verified subject matter experts