

Question: 1 block 1/4 1. Block =1/4 When you have detennined a group of experimtital quantities, you can prepurt a gupb that gives a pistorial

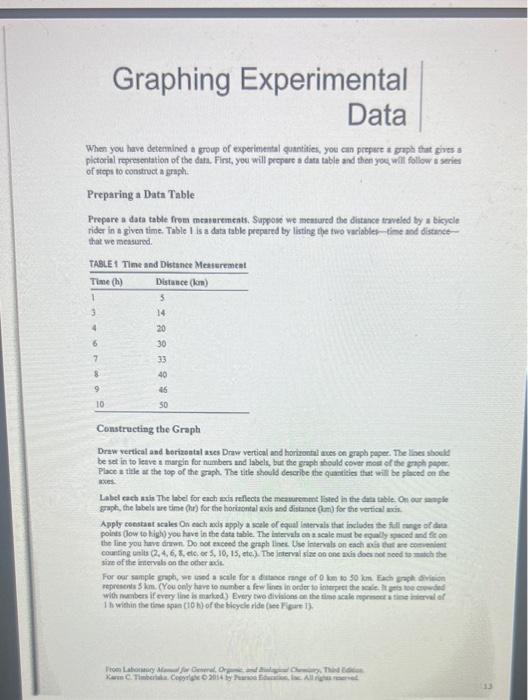
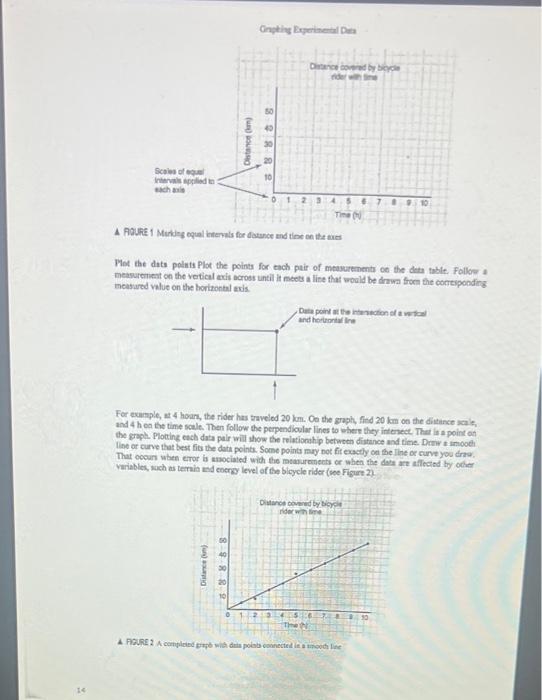
1. Block =1/4 " When you have detennined a group of experimtital quantities, you can prepurt a gupb that gives a pistorial ropresentation of the daha. First, yoe will propere a data table and then you will follow a series of teps to construct a graph. Preparing a Data Table Prepore a data table frem measurements. Suppose we meatured the distance traveled by a bicycle that we racasured. Construeting the Graph Draw vertical and beriasatal ases Drav vertical and honizontal awes on graph peper. The lines abould be set in to leave it mangin for numbers and labels, but the 5 reply theold covtr moer of the graph paser. Place a title at the lop of the saph. The title sheuld describe the quantitien that will be placed on the axes. Label cach suis The label for each mis reflectn the meaturcome Fisted in the dra nole. On our angle Fraph, the bbele are time (hr) for the horinontal axis and ditarise (am) for the vertical axin. Apply constast acales On each mois apply a reake of equal lotervals that includes the fut rarge of dua points dow te bigh) you have in the data table. The intervala aa a seale must be roally spacod and ff on. size of the insevils on the odver axic. For our sanple groht, we sned a scale for a dirtance range of 0 lon io 50km finh gagh sivition 1h within the time span (10 h) of the bicycle ride (yet Figat 1). 4 Fause 1 Mindisg equal haterals for detunce and tion an that anes Mot the dats points Plot the points for tach pair of measerenents oo the deth table. Follos a measureneat on the vetical exis across until it nects a line that would be drwwa from the conciponding measared value on the horizontal axis. For example, at 4 hoan, the rider has taveled 20km. Oo the graph, find 20km os the dittinse scals, and 4 h on the time soale. Then follow the perpendioular lines to whene they intereet That is a point an the graph. Ploting each data palr will show the relationahip between distance and time. Derw a simooch. lise at curve that best fit the data points. Sone points nuy not fir exactly on the line or curve you drow. That ocoun when eror is anociated with the msanuranects or when the deta are affecend by oder variables, wach as terain md eoergy level of the bicycle rider (see Figurt 2). 1. Block =1/4 " When you have detennined a group of experimtital quantities, you can prepurt a gupb that gives a pistorial ropresentation of the daha. First, yoe will propere a data table and then you will follow a series of teps to construct a graph. Preparing a Data Table Prepore a data table frem measurements. Suppose we meatured the distance traveled by a bicycle that we racasured. Construeting the Graph Draw vertical and beriasatal ases Drav vertical and honizontal awes on graph peper. The lines abould be set in to leave it mangin for numbers and labels, but the 5 reply theold covtr moer of the graph paser. Place a title at the lop of the saph. The title sheuld describe the quantitien that will be placed on the axes. Label cach suis The label for each mis reflectn the meaturcome Fisted in the dra nole. On our angle Fraph, the bbele are time (hr) for the horinontal axis and ditarise (am) for the vertical axin. Apply constast acales On each mois apply a reake of equal lotervals that includes the fut rarge of dua points dow te bigh) you have in the data table. The intervala aa a seale must be roally spacod and ff on. size of the insevils on the odver axic. For our sanple groht, we sned a scale for a dirtance range of 0 lon io 50km finh gagh sivition 1h within the time span (10 h) of the bicycle ride (yet Figat 1). 4 Fause 1 Mindisg equal haterals for detunce and tion an that anes Mot the dats points Plot the points for tach pair of measerenents oo the deth table. Follos a measureneat on the vetical exis across until it nects a line that would be drwwa from the conciponding measared value on the horizontal axis. For example, at 4 hoan, the rider has taveled 20km. Oo the graph, find 20km os the dittinse scals, and 4 h on the time soale. Then follow the perpendioular lines to whene they intereet That is a point an the graph. Ploting each data palr will show the relationahip between distance and time. Derw a simooch. lise at curve that best fit the data points. Sone points nuy not fir exactly on the line or curve you drow. That ocoun when eror is anociated with the msanuranects or when the deta are affecend by oder variables, wach as terain md eoergy level of the bicycle rider (see Figurt 2)
Step by Step Solution
There are 3 Steps involved in it

Get step-by-step solutions from verified subject matter experts