

Question: 1 Calculate basic profitability ratios (ROA, ROE, RNOA (i.e., net return on operating assets) ) including stock based compensation as an expense and excluding stock
1 Calculate basic profitability ratios (ROA, ROE, RNOA (i.e., net return on operating assets) ) including stock based compensation as an expense and excluding stock based compensation as an expense. Consider cash, short term investments, and long-term investments as financial assets and assume the operating requirement is that financial assets should be 40% of sales.
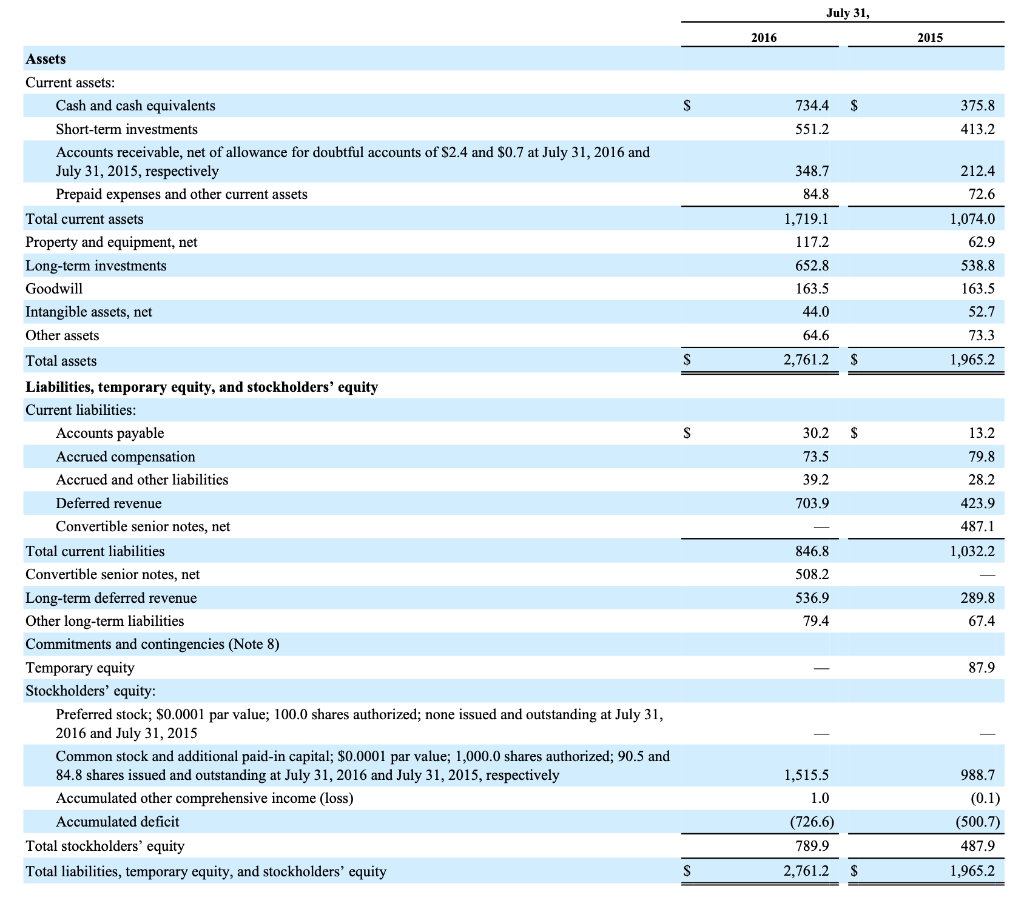
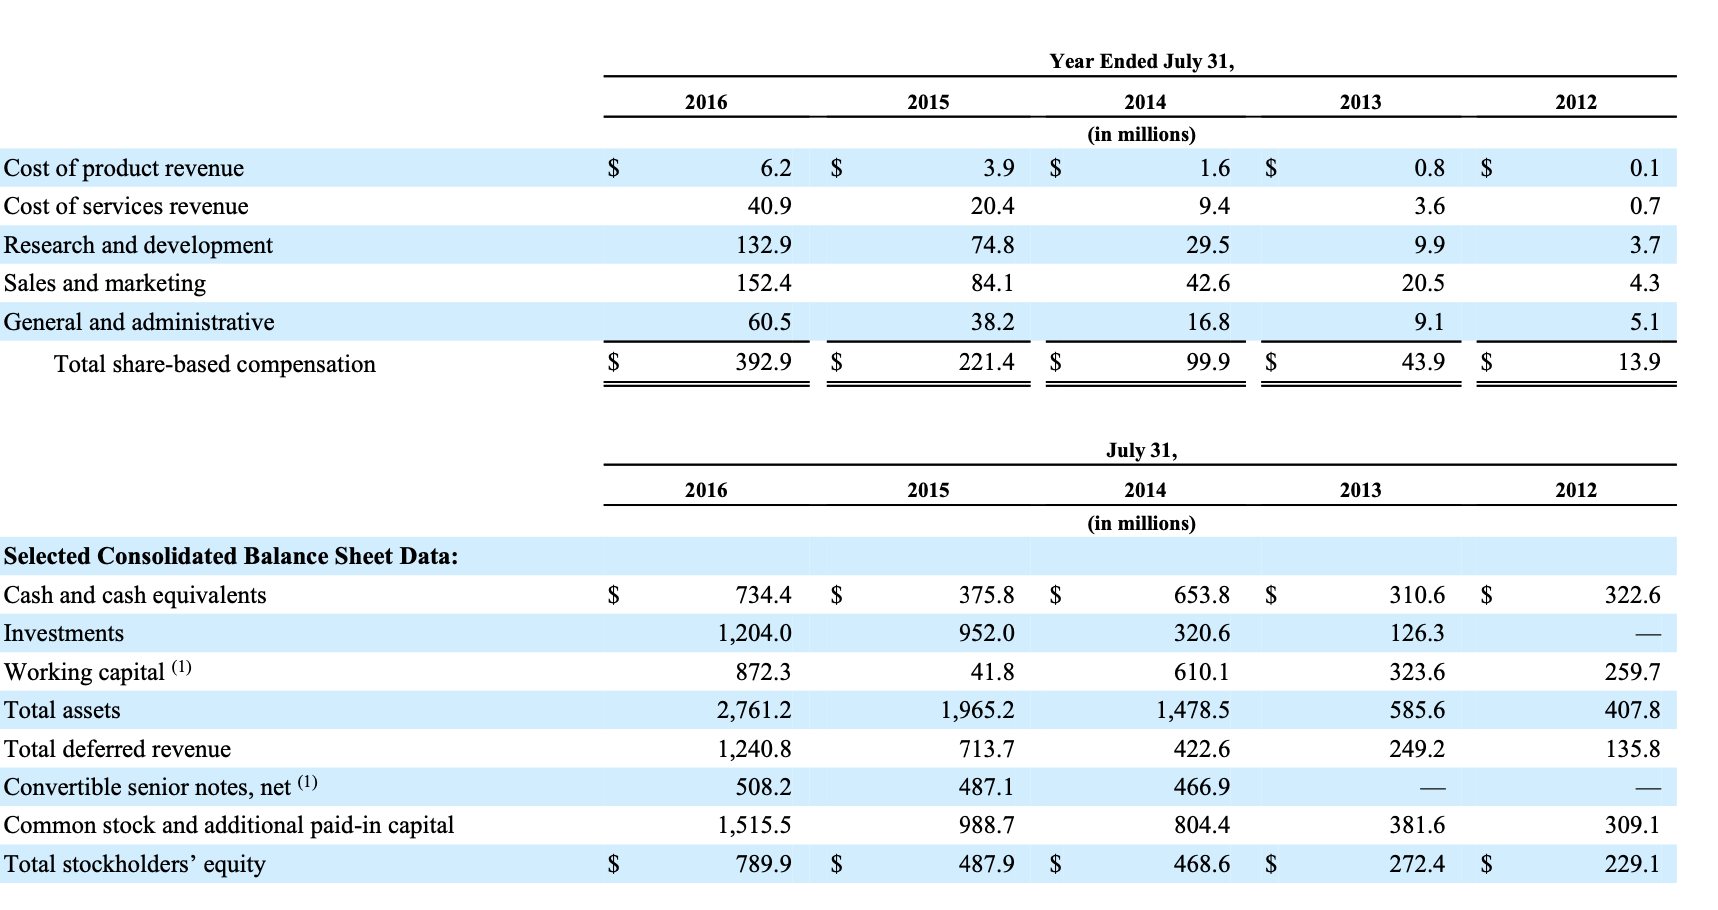
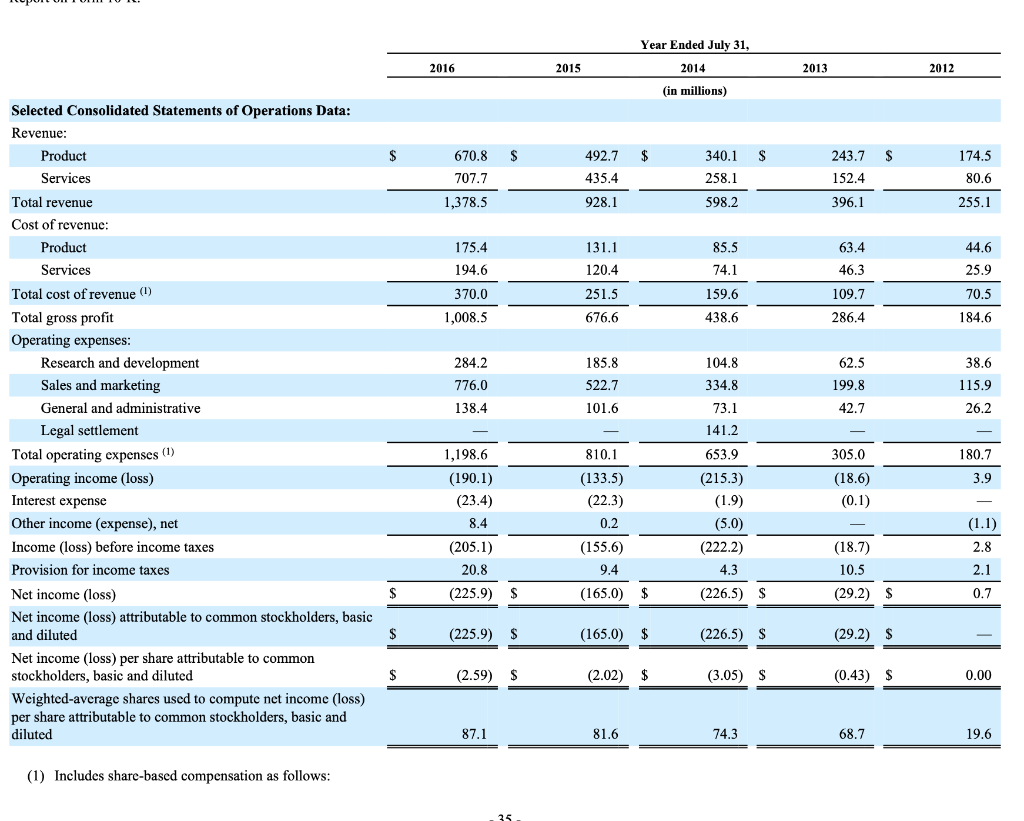
July 31, 2016 2015 s $ 734.4 551.2 375.8 413.2 348.7 212.4 84.8 72.6 1,074.0 62.9 1,719.1 117.2 652.8 163.5 44.0 538.8 163.5 52.7 64.6 73.3 S 2,761.2 1,965.2 S Assets Current assets: Cash and cash equivalents Short-term investments Accounts receivable, net of allowance for doubtful accounts of $2.4 and $0.7 at July 31, 2016 and July 31, 2015, respectively Prepaid expenses and other current assets Total current assets Property and equipment, net Long-term investments Goodwill Intangible assets, net Other assets Total assets Liabilities, temporary equity, and stockholders' equity Current liabilities: Accounts payable Accrued compensation Accrued and other liabilities Deferred revenue Convertible senior notes, net Total current liabilities Convertible senior notes, net Long-term deferred revenue Other long-term liabilities Commitments and contingencies (Note 8) Temporary equity Stockholders' equity: Preferred stock; $0.0001 par value; 100.0 shares authorized; none issued and outstanding at July 31, 2016 and July 31, 2015 Common stock and additional paid-in capital; $0.0001 par value; 1,000.0 shares authorized; 90.5 and 84.8 shares issued and outstanding at July 31, 2016 and July 31, 2015, respectively Accumulated other comprehensive income (loss) Accumulated deficit Total stockholders' equity Total liabilities, temporary equity, and stockholders' equity 30.2 73.5 39.2 703.9 13.2 79.8 28.2 423.9 487.1 1,032.2 846.8 508.2 536.9 289.8 67.4 79.4 87.9 1,515.5 1.0 (726.6) 789.9 988.7 (0.1) (500.7) 487.9 S 2,761.2 $ 1,965.2 Year Ended July 31, 2016 2015 2014 2013 2012 (in millions) 1.6 $ 6.2 $ 3.9 $ $ 0.8 $ 0.1 40.9 20.4 9.4 3.6 0.7 74.8 29.5 9.9 3.7 Cost of product revenue Cost of services revenue Research and development Sales and marketing General and administrative Total share-based compensation 132.9 152.4 60.5 84.1 42.6 20.5 4.3 38.2 16.8 9.1 5.1 $ 392.9 $ 221.4 $ 99.9 $ 43.9 $ 13.9 July 31, 2016 2015 2014 2013 2012 (in millions) $ $ 375.8 $ 653.8 $ 310.6 $ 322.6 734.4 1,204.0 952.0 320.6 126.3 872.3 41.8 323.6 Selected Consolidated Balance Sheet Data: Cash and cash equivalents Investments Working capital (1) Total assets Total deferred revenue Convertible senior notes, net (1) Common stock and additional paid-in capital Total stockholders' equity 610.1 1,478.5 422.6 259.7 407.8 1,965.2 713.7 585.6 249.2 135.8 2,761.2 1,240.8 508.2 1,515.5 487.1 466.9 988.7 804.4 381.6 309.1 $ 789.9 $ 487.9 $ 468.6 $ 272.4 $ 229.1 Year Ended July 31, 2016 2015 2014 2013 2012 (in millions) S S S 670.8 707.7 492.7 435.4 340.1 258.1 243.7 152.4 174.5 80.6 1,378.5 928.1 598.2 396.1 255.1 131.1 175.4 194.6 85.5 74.1 63.4 46.3 44.6 25.9 120.4 251.5 159.6 70.5 370.0 1,008.5 109.7 286.4 676.6 438.6 184.6 38.6 284.2 776.0 138.4 185.8 522.7 101.6 104.8 334.8 62.5 199.8 115.9 42.7 26.2 Selected Consolidated Statements of Operations Data: Revenue: Product Services Total revenue Cost of revenue: Product Services Total cost of revenue (1) Total gross profit Operating expenses: Research and development Sales and marketing General and administrative Legal settlement Total operating expenses (1) Operating income (loss) Interest expense Other income (expense), net Income (loss) before income taxes Provision for income taxes Net income (loss) Net income (loss) attributable to common stockholders, basic and diluted Net income (loss) per share attributable to common stockholders, basic and diluted Weighted-average shares used to compute net income (loss) per share attributable to common stockholders, basic and diluted 73.1 141.2 810.1 653.9 305.0 180.7 3.9 (133.5) (22.3) (18.6) (0.1) 1,198.6 (190.1) (23.4) 8.4 (205.1) 20.8 (225.9) $ 0.2 (215.3) (1.9) (5.0) (222.2) 4.3 (1.1) 2.8 (155.6) 9.4 (18.7) 10.5 2.1 (165.0) $ (226.5) $ (29.2) $ 0.7 (225.9) $ (165.0) (226.5) $ (29.2) $ (2.59) $ (2.02) $ (3.05) $ (0.43) $ 0.00 87.1 81.6 74.3 68.7 19.6 (1) Includes share-based compensation as follows
Step by Step Solution
There are 3 Steps involved in it

Get step-by-step solutions from verified subject matter experts