

Question: 1. Calculate descriptive sample statistics (mean, median, range, the two quartiles Q1 and Q3 (using QUARTILE.EXC), minimum, maximum, interquartile range, sample standard deviation, and coefficient
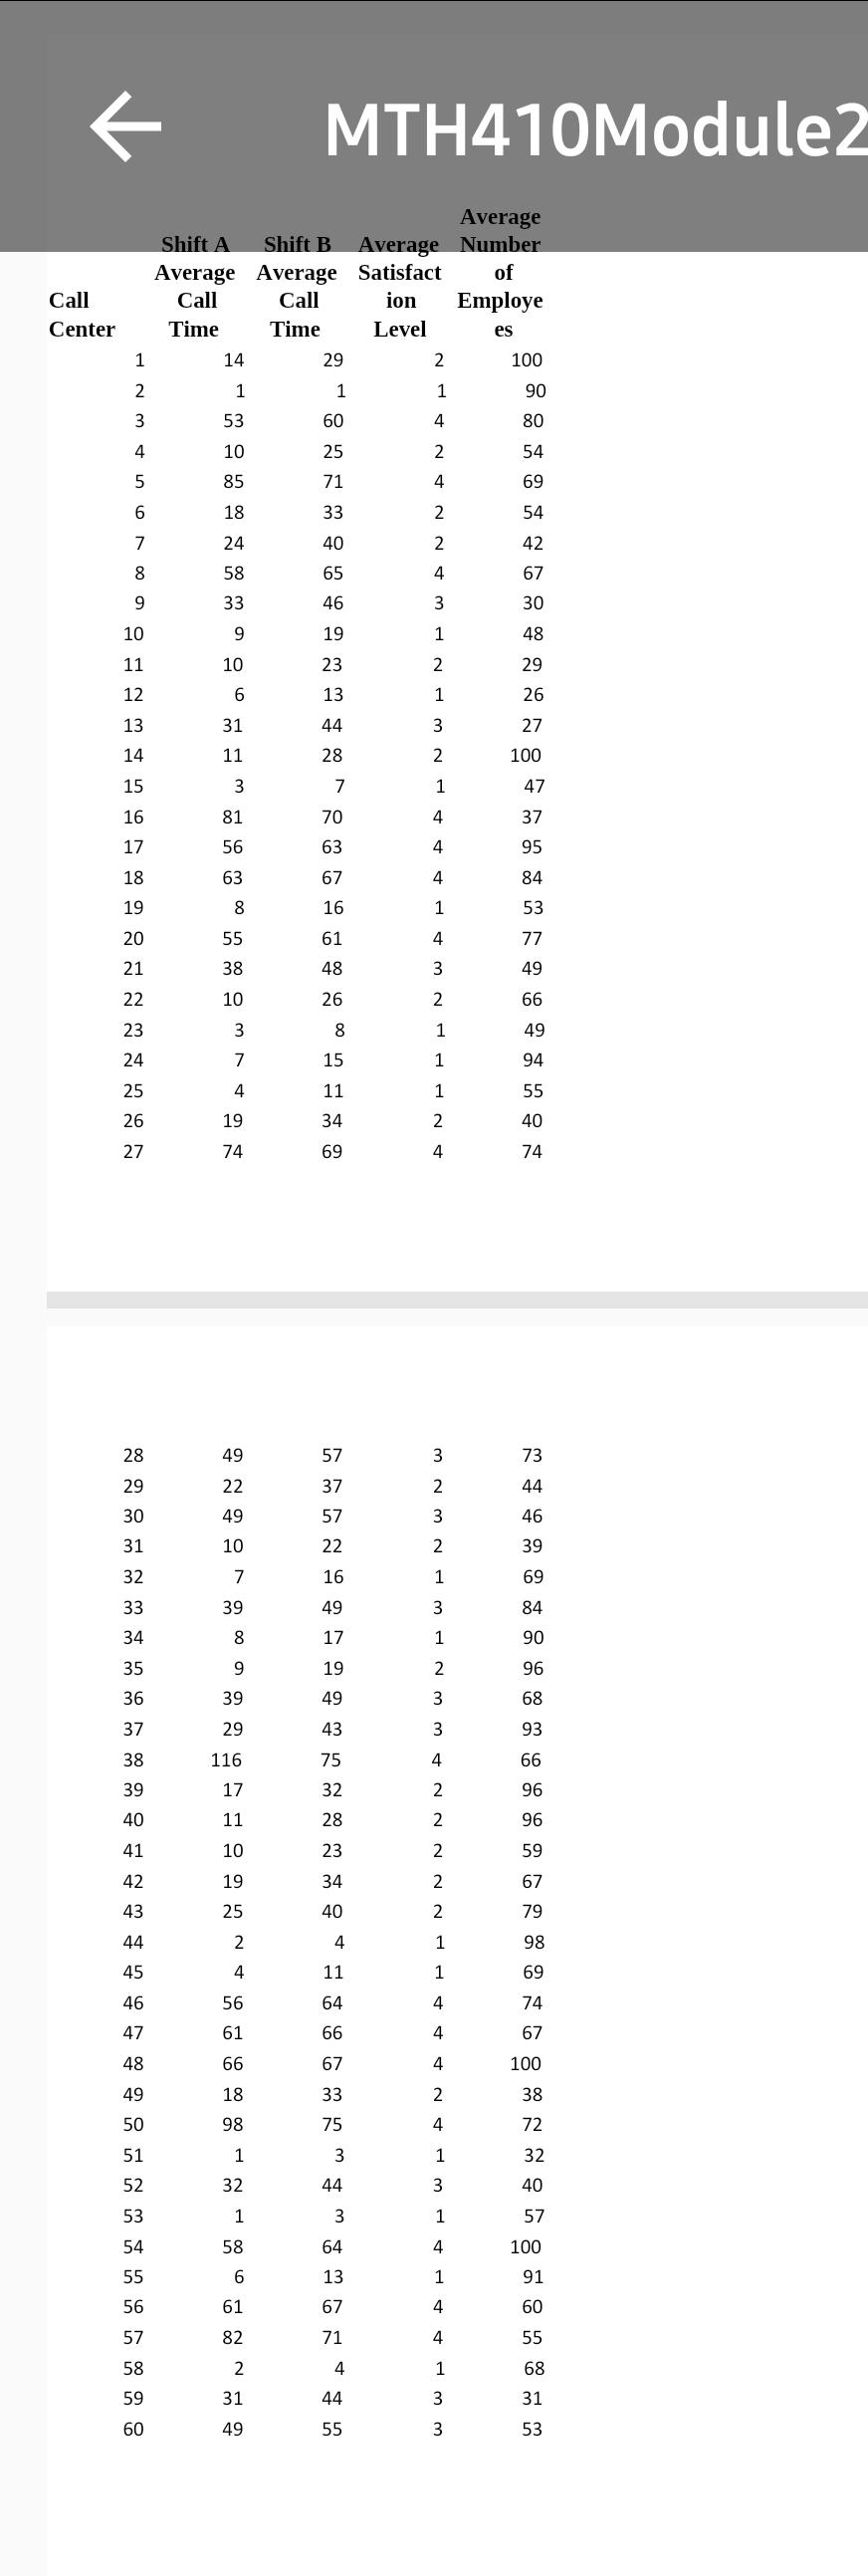
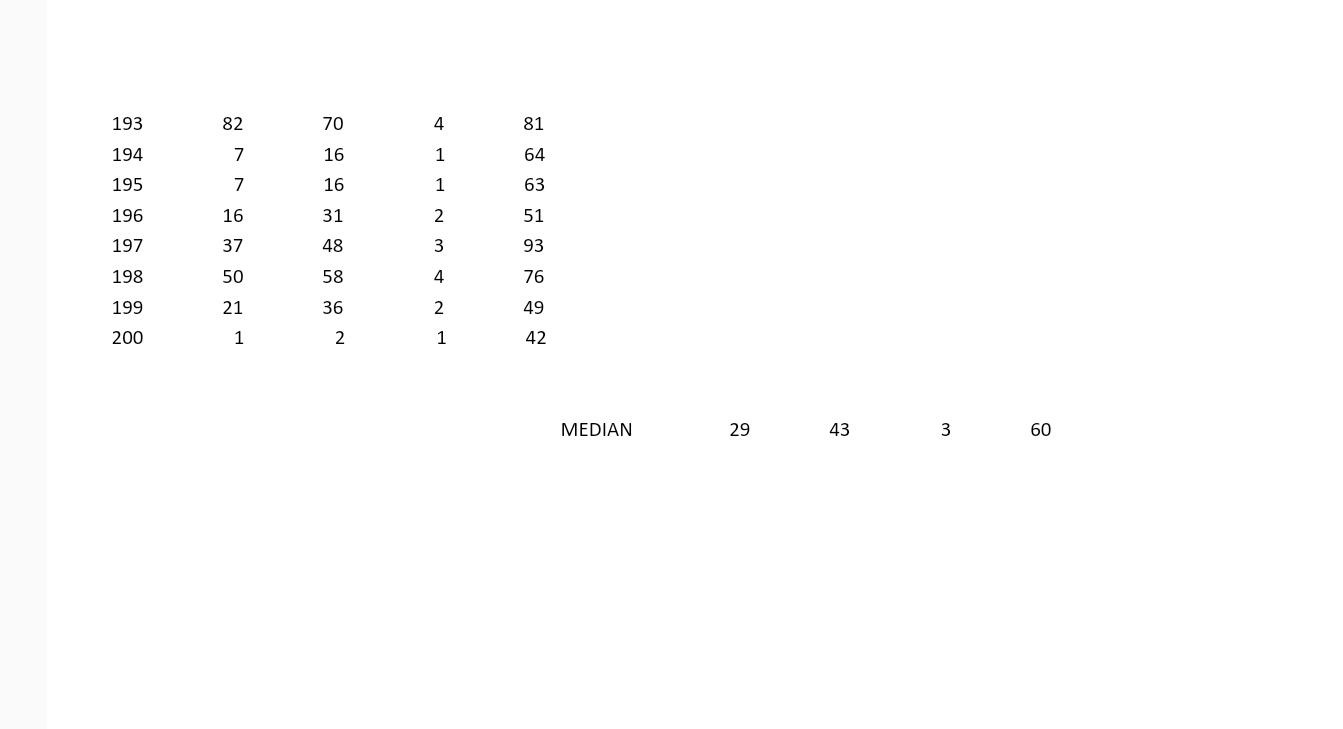 1. Calculate descriptive sample statistics (mean, median, range, the two quartiles Q1 and Q3 (using QUARTILE.EXC), minimum, maximum, interquartile range, sample standard deviation, and coefficient of variation) for each of the four variables, along with an explanation of what the descriptive statistics tell us about the call centers. o In this case, which measure of central tendency would be best for this application? Explain why. o Which measure of variation would be best for this application? Explain why. o How can one use the above descriptive statistics to understand the call centers better? o Which graphical displays of data would you use to help understand or complement the above descriptive statistics? Explain how and why.
Step by Step Solution
There are 3 Steps involved in it

Get step-by-step solutions from verified subject matter experts