

Question: 1. Calculate the expected return and standard deviation for the two stocks. X 5 ? Calculating Retums and Standard Deviations - Excel PAGE LAYOUT FORMULAS
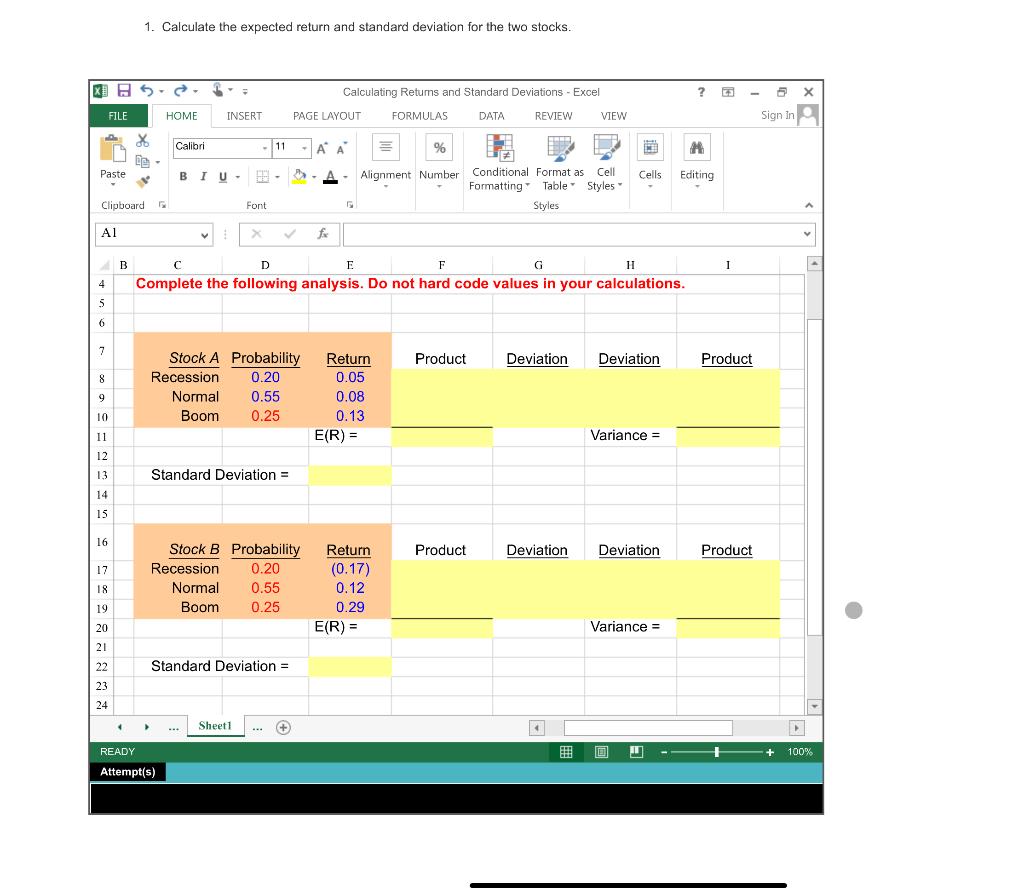
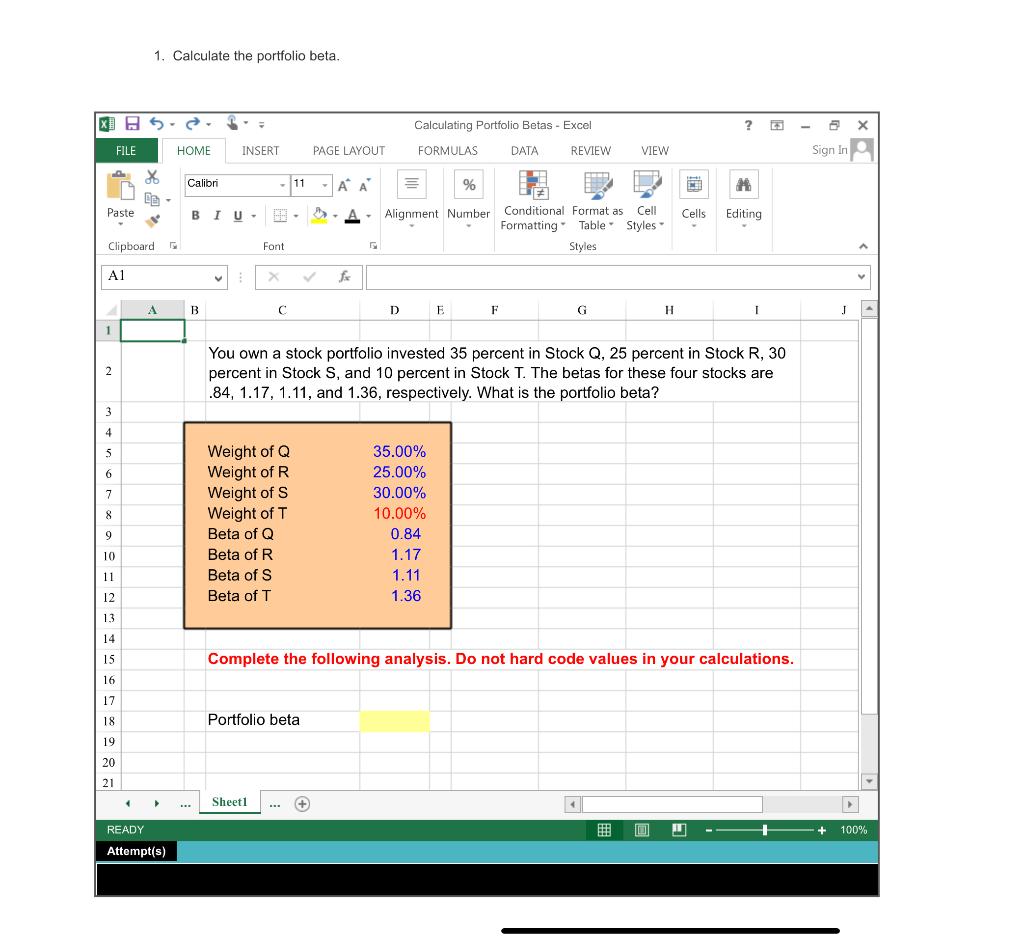
1. Calculate the expected return and standard deviation for the two stocks. X 5 ? Calculating Retums and Standard Deviations - Excel PAGE LAYOUT FORMULAS DATA REVIEW VIEW FILE HOME INSERT Sign in Calibri - 11 AA Paste BIU- % Alignment Number Conditional Format as Cell Formatting Table Styles Styles Cells Editing Clipboard Font A Al v B 1 4 D E F G H Complete the following analysis. Do not hard code values in your calculations. S 6 7 Product Deviation Deviation Product 8 Stock A Probability Recession 0.20 Normal 0.55 Boom 0.25 9 Return 0.05 0.08 0.13 E(R) = 10 11 Variance = 12 13 Standard Deviation = 14 15 16 Product Deviation Deviation Product 17 Stock B Probability Recession 0.20 Normal 0.55 Boom 0.25 18 Return (0.17) 0.12 0.29 E(R) = 19 20 Variance = 21 22 Standard Deviation = 23 24 Sheet1 - + READY 100% Attempt(s) 1. Calculate the portfolio beta. XI - Calculating Portfolio Betas - Excel FILE HOME INSERT PAGE LAYOUT FORMULAS DATA REVIEW VIEW Sign In Calibri 11 AA A Paste BIU % Alignment Number Conditional Format as Cell Formatting Table Styles Styles Cells Editing Clipboard Font A1 f fx A B c D E F G H 1 J 1 2 You own a stock portfolio invested 35 percent in Stock Q, 25 percent in Stock R, 30 percent in Stock S, and 10 percent in Stock T. The betas for these four stocks are .84, 1.17, 1.11, and 1.36, respectively. What is the portfolio beta? 3 4 5 6 7 8 Weight of Q Weight of R Weight of S Weight of T Beta of Q Beta of R Beta of S Beta of T 35.00% 25.00% 30.00% 10.00% 0.84 1.17 1.11 1.36 9 10 11 12 13 14 15 Complete the following analysis. Do not hard code values in your calculations. 16 17 18 Portfolio beta 19 20 21 Sheet1 + 100% READY Attempt(s)
Step by Step Solution
There are 3 Steps involved in it

Get step-by-step solutions from verified subject matter experts