

Question: 1. Calculate the expected return and standard deviation for the two stocks. X 5 ? Calculating Returns and Standard Deviations - Excel PAGE LAYOUT FORMULAS
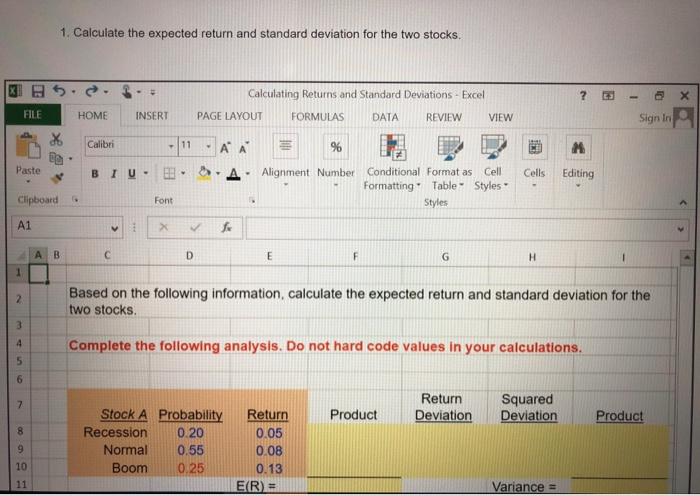
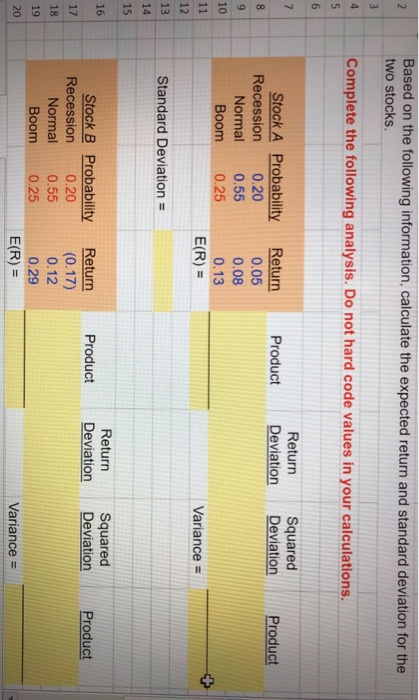
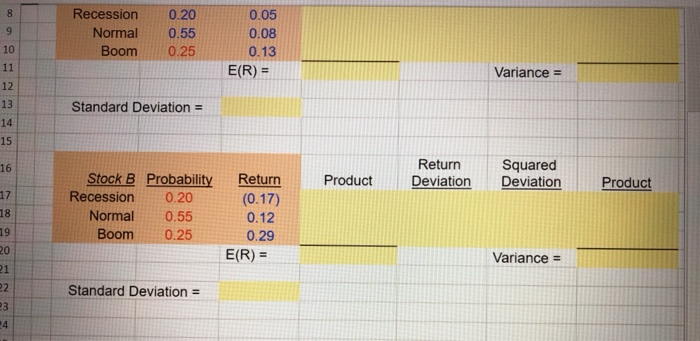
1. Calculate the expected return and standard deviation for the two stocks. X 5 ? Calculating Returns and Standard Deviations - Excel PAGE LAYOUT FORMULAS DATA REVIEW VIEW FILE HOME INSERT Sign In X Calibri 11 A A 96 Paste BIU- Cells Editing Alignment Number Conditional Format as Cell Formatting Table - Styles Styles Clipboard Font A1 X V fx AB D E F G H 1 2 Based on the following information, calculate the expected return and standard deviation for the two stocks. 3 4 Complete the following analysis. Do not hard code values in your calculations. 5 6 7 Product Return Deviation Squared Deviation Product 8 Stock A Probability Recession 0.20 Normal 0.55 Boom 0.25 9 Return 0.05 0.08 0.13 E(R) = 10 11 Variance = 2 Based on the following information, calculate the expected return and standard deviation for the two stocks. 3 4 Complete the following analysis. Do not hard code values in your calculations. 5 6 7 Product Return Deviation Squared Deviation Product 8 Stock A Probability Recession 0.20 Normal 0.55 Boom 0.25 9 Return 0.05 0.08 0.13 E(R) = 10 11 Variance = 12 13 Standard Deviation = 14 15 16 Product Return Deviation Squared Deviation Product 17 Stock B Probability Recession 0.20 Normal 0.55 Boom 0.25 18 Return (0.17) 0.12 0.29 E(R) = 19 20 Variance = 8 9 Recession Normal Boom 0.20 0.55 0.25 10 0.05 0.08 0.13 E(R) = 11 Variance = 12 13 14 Standard Deviation = 15 16 Product Return Deviation Squared Deviation Product 17 Stock B Probability Recession 0.20 Normal 0.55 Boom 0.25 18 Return (0.17) 0.12 0.29 E(R) = 19 20 Variance = 21 22 23 24 Standard Deviation =
Step by Step Solution
There are 3 Steps involved in it

Get step-by-step solutions from verified subject matter experts