

Question: 1. Categorizing, Summarizing, and Displaying Data Consider the following sample of 6 adults for the year 2024. Annual Number of Individual Race Education Income Children
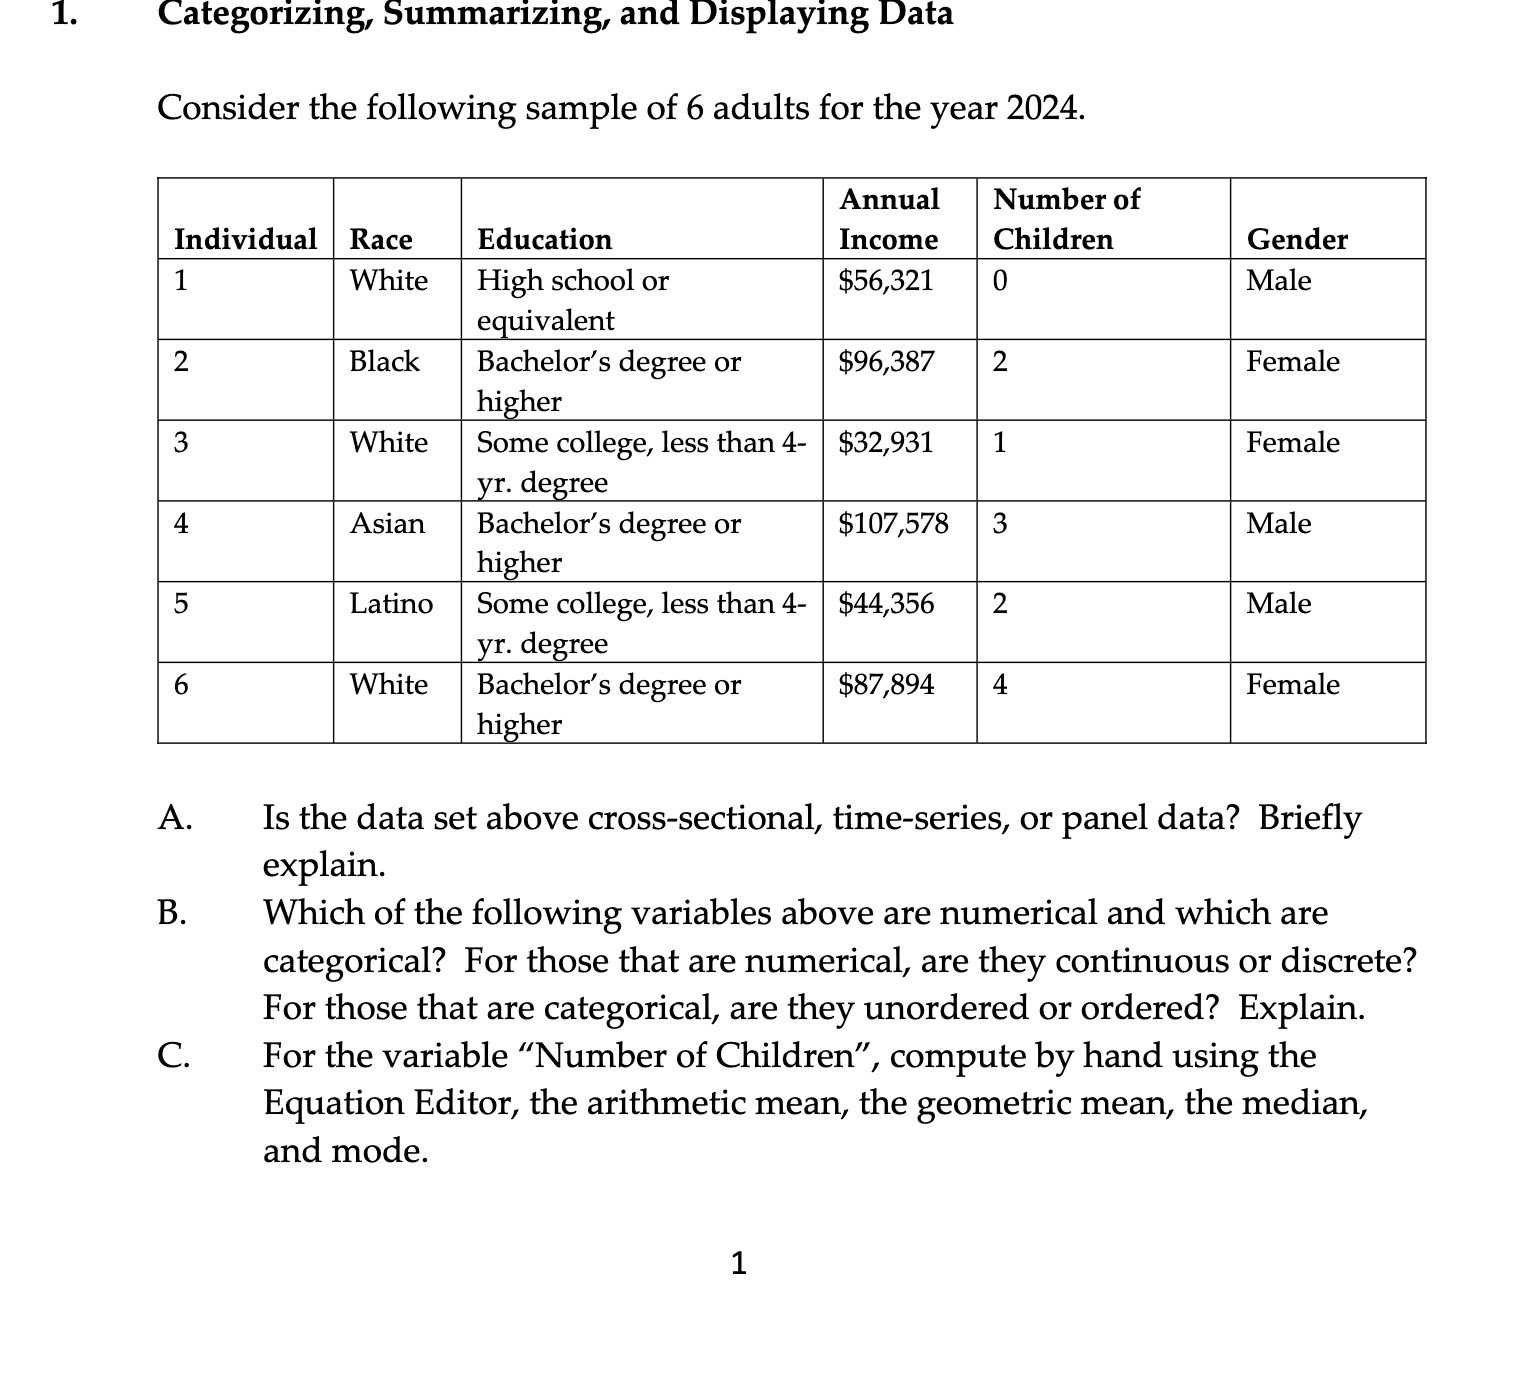
1. Categorizing, Summarizing, and Displaying Data Consider the following sample of 6 adults for the year 2024. Annual Number of Individual Race Education Income Children Gender 1 White High school or $56,321 0 Male equivalent 2 Black Bachelor's degree or $96,387 2 Female higher 3 White Some college, less than 4- $32,931 1 Female yr. degree 4 Asian Bachelor's degree or $107,578 3 Male higher 5 Latino Some college, less than 4- $44,356 2 Male yr. degree 6 White Bachelor's degree or $87,894 4 Female higher A. Is the data set above cross-sectional, time-series, or panel data? Briefly explain. B. Which of the following variables above are numerical and which are categorical? For those that are numerical, are they continuous or discrete? For those that are categorical, are they unordered or ordered? Explain. C. For the variable "Number of Children", compute by hand using the Equation Editor, the arithmetic mean, the geometric mean, the median, and mode
Step by Step Solution
There are 3 Steps involved in it

Get step-by-step solutions from verified subject matter experts