

Question: 1 # CG QO# Read the data file bikeshare. CSV into R and nane the object bikes. 2 #mNNN# As usual, don't forget the strings
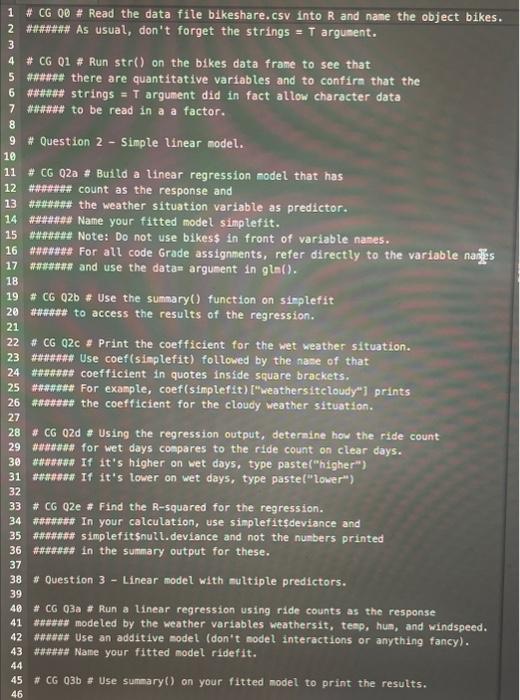
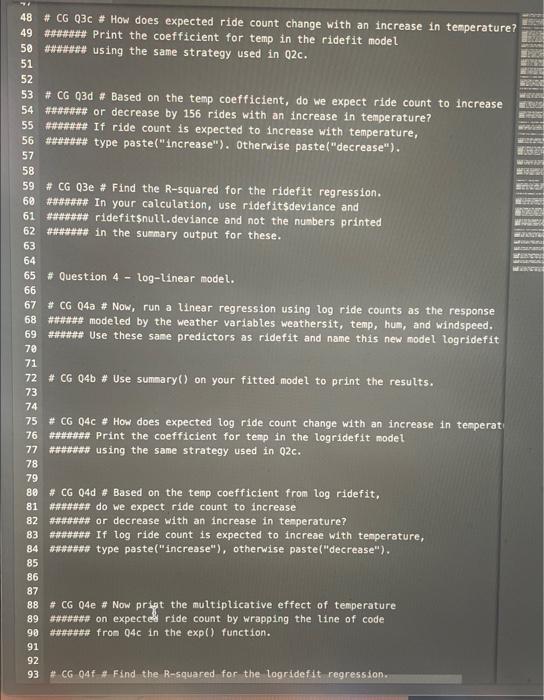
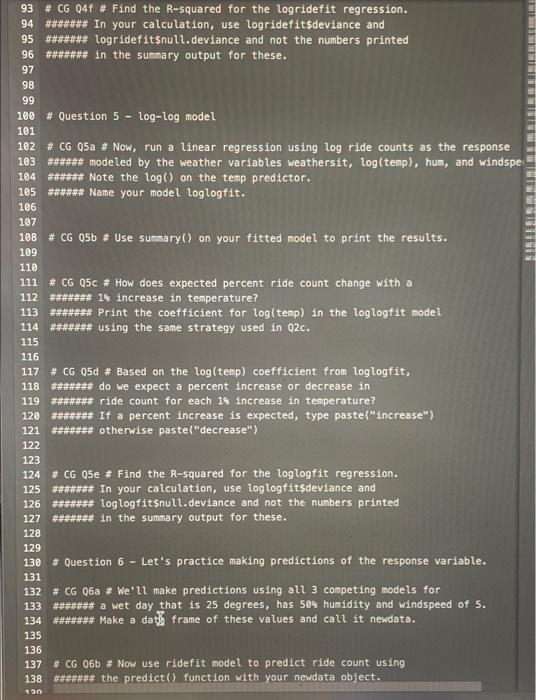
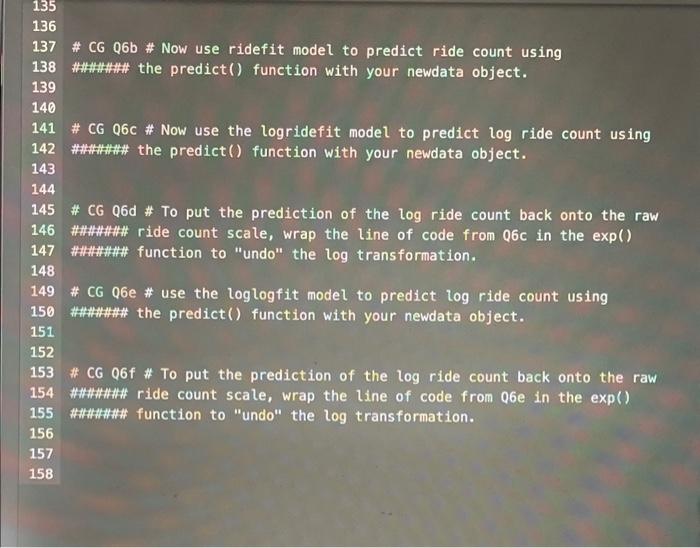
1 \# CG QO\# Read the data file bikeshare. CSV into R and nane the object bikes. 2 \#mNNN# As usual, don't forget the strings = T argunent, \# CG Q1 \# Run str() on the bikes data frane to see that \#\#\#HNNN there are quantitative variables and to confira that the \#\#NH\#\#\#\# strings = T argument did in fact allow character data NNN to be read in a a factor. \# Question 2 - Simple linear model. * CG Q2a * Build a linear regression nodel that has \#NNNNHAn count as the response and 13 \#tntnN the weather situation variable as predictor. 14 \#\#NNNNNN Name your fitted model simplefit. \#\#\#\#\#\#\#\# For all code Grade assignments, refer directly to the variable nailgs \#\#\#NHIM\#\# and use the data= argunent in g tal () . \# CG Q2b \# Use the sumary() function on simplefit N to access the results of the regression. \# CG Q2C Print the coefficient for the wet weather situation. \#HAH(An\# Use coef(simplefit) followed by the nase of that HAMANAN coefficient in quotes inside square brackets. \#\#\#n\#\#\# For example, coef(sinplefit) ["weathersiteloudy"l prints IAmNAn\#t the coefficient for the cloudy weather situation. * CG 02d \# Using the regression output, deternine how the ride count \#\#It for wet days coapares to the ride count on clear days. HAH!MAN If it's higher on wet days, type paste("higher") \# CG Q2e \# Find the R-squared for the regression. \#\#\#\#NA\# In your calculation, use simplefitsdeviance and ANNNA simplefitsnull. deviance and not the nunbers printed \#\#\#AA in the summary output for these. * Question 3 - Linear model with nuttiple predictors. \# CG Q3a \# Run a linear regression using ride counts as the response \#HHHAttH Use an additive model (don't nodel interactions or anything fancy). \#HNN Name your fitted model ridefit. \# CG 03b : Use summary() on your fitted model to print the results. \# CG Q3c \# How does expected ride count change with an increase in temperature? \#CG Q3d \# Based on the temp coefficient, do we expect ride count to increase \#ANA\#\# or decrease by 156 rides with an increase in temperature? \#H\# type paste("increase"). Otherwise paste("decrease"). \# CG Q3e \# Find the R-squared for the ridefit regression. +AN+NA In your calculation, use ridefitsdeviance and HAH(HA\# ridefitsnull, deviance and not the nuabers printed \# Question 4 - log-linear model. \# CG O4a \# Now, run a linear regression using log ride counts as the response \#\#IHH\#H modeled by the weather variables weathersit, temp, hum, and windspeed. \#NHHWH Use these sase predictors as ridefit and name this new model logridefit \# CG Q4b \# Use summary() on your fitted model to print the results. \# CG Q4C \# How does expected log ride count change with an increase in tenperat NNNNN Print the coefficient for temp in the logridefit model \# CG Q4d \# Based on the temp coefficient from log ridefit, ANHNHAHAN do we expect ride count to increase ANAHAHA\# or decrease with an increase in temperature? ANAH+AN If log ride count is expected to increae with tenperature, HNHAN tye paste("increase"), otherwise paste("decrease"). \# CG 04e \# Now pript the multiplicative effect of temperature \#NHHHAN on expected ride count by wrapping the line of code \#NANANA fron Q4c in the exp() function. \#CG Q4f \# Find the R-squared for the lagridefit regression. \# CG Q4F \# Find the R-squared for the logridefit regression. \#\#\#\#\#\#\#\#\#\# In your calculation, use logridefitsdeviance and \#\#\#\#\#\#\#\# Logridefitsnull. deviance and not the numbers printed \#N in the sumary output for these. \#Question 5 - loglog model \# CG 05a \# Now, run a linear regression using log ride counts as the respor "NANHAN\# modeled by the weather variables weathersit, log(temp), hum, and win IIIIIIHAH Note the log() on the temp predictor. \#\#\#\#n\#\# Name your model loglogfit. \# CG Q5b \# Use sumsary() on your fitted nodel to print the results. \# CG Q5C \# How does expected percent ride count change with a \#IIn\#\#IA\# 18 increase in temperature? NNNNNN Print the coefficient for log(temp) in the loglogfit nodel \#\#\#\#\#\# using the same strategy used in Q2 c. \# CG 05d \# Based on the log(temp) coefficlent from loglogfit, N#\#\# do we expect a percent increase or decrease in \#\#\#\#\#\#\# ride count for each 14 increase in temperature? \#NHNNAN If a percent increase is expected, type paste("increase") \#CG Q5e \# Find the R-squared for the loglogfit regression. \# In your calculation, use loglogfitsdeviance and NNN loglogfitsnull. deviance and not the numbers printed ANA\#\#\#\#\# in the summary output for these. \# Question 6 - Let's practice making predictions of the response variable. \# CG Q6a \# We'll make predictions using all 3 conpeting nodels for \# CG Q6b \# Now use rideft model to predict ride count using Intnnnn\# the predict() function with your newdata object. \# CG Q6b \# Now use ridefit model to predict ride count using \#\#\#\#\#\# the predict() function with your newdata object. \# CG Q6C \# Now use the logridefit model to predict log ride count using \#\#\#\#\#\# the predict() function with your newdata object. \# CG Q6d \# To put the prediction of the log ride count back onto the raw \#\#\#\#\#\#\# ride count scale, wrap the line of code from Q6c in the exp() \#\#\#\#\#\#\# function to "undo" the log transformation. \# CG Q6e \# use the loglogfit model to predict log ride count using \#\#\#\#\# the predict() function with your newdata object. \# CG Q6f \# To put the prediction of the log ride count back onto the raw \#\#\#\#\#\#\# ride count scale, wrap the line of code from 06 e in the exp() \#\#\#\#\#\#\#\# function to "undo" the log transformation
Step by Step Solution
There are 3 Steps involved in it

Get step-by-step solutions from verified subject matter experts