

Question: I need help with all these questions 1 # CG QO # Read the data file bikeshare.csv into R and name the object bikes #######
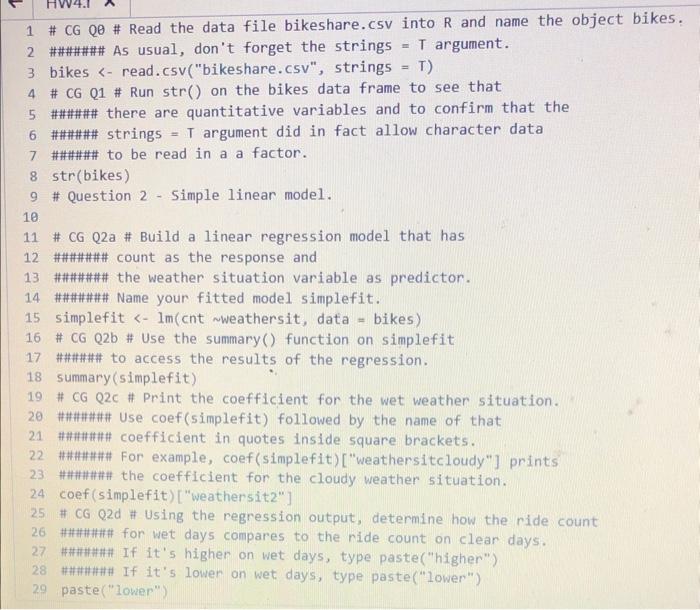
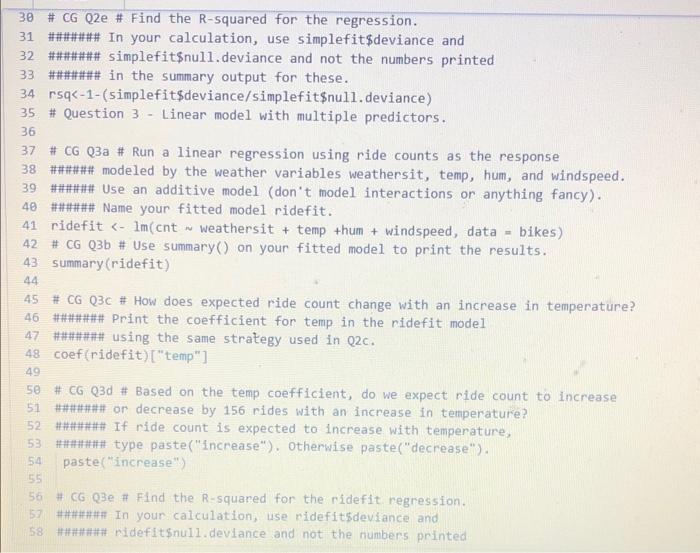
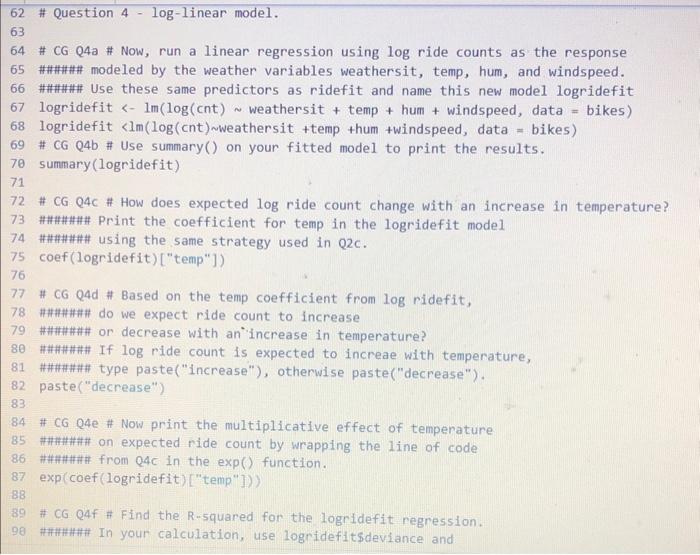
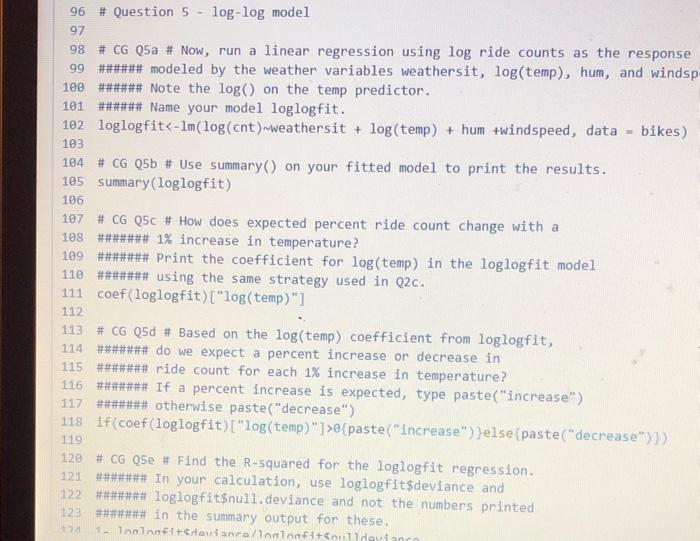
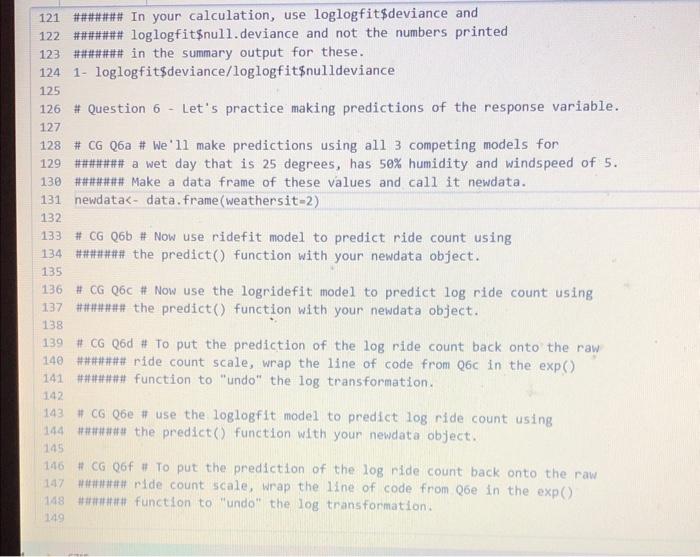
1 \# CG QO \# Read the data file bikeshare.csv into R and name the object bikes \#\#\#\#\#\#\# As usual, don't forget the strings = T argument. bikes T ) \# CG Q1 \# Run str() on the bikes data frame to see that \#\#\#\#\#\# there are quantitative variables and to confirm that the \#\#\#\#\#\# strings =T argument did in fact allow character data \#\#\#\#\# to be read in a factor. 8 str(bikes) 9 \# Question 2 - Simple linear model. \# CG Q2a \# Build a linear regression model that has \#\#\#\#\#\#\# count as the response and \#\#\#\#\#\#\# the weather situation variable as predictor. \#\#\#\#\#\#\# Name your fitted model simplefit. simplefit t model interactions or anything fancy). 48 \#\#\#\#\#\# Name your fitted model ridefit. 41 ridefit weathersit + temp +hum + windspeed, data = bikes) 42 \# CG Q3b \# Use summary() on your fitted model to print the results. 43 summary (ridefit) 44 45 \# CG Q3C \# How does expected ride count change with an increase in temperature? 46 \#\#\#\#\#\#\# Print the coefficient for temp in the ridefit model 47 \#\#\#\#\#\#\# using the same strategy used in Q2c. 48 coef(ridefit) ["temp"] 49 50 \# CG Q3d \# Based on the temp coefficient, do we expect ride count to increase 51 \#\#\#\#\#\# or decrease by 156 rides with an increase in temperature? 52 \#\#\#\#\#\#\# If ride count is expected to increase with temperature, 53 \#\#\#\#\#\#\# type paste("Increase"). Otherwise paste("decrease"). 54 paste( "increase") 56 \# CG Q3e \# Find the R-squared for the ridefit regression. 57. \#\#\#\#\#\#\# In your calculation, use ridefitsdeviance and 58. \#\#\#\#\#\#\#\# nidefitsnu11. deviance and not the numbers printed 63 64 \# CG Q4a \# Now, run a linear regression using log ride counts as the response 65 \#\#\#\#\# modeled by the weather variables weathersit, temp, hum, and windspeed. 66 \#\#\#\#\#\# Use these same predictors as ridefit and name this new model logridefit 67 logridefit \& lm(log(cnt) weathersit + temp + hum + windspeed, data = bikes) 68 logridefit (log(cnt) weathersit + temp +hum +windspeed, data = bikes) 69 \# CG Q4b \# Use summary() on your fitted model to print the results. 70 summary (logridefit) 71 72. \# CG Q4C \# How does expected log ride count change with an increase in temperature? 73 \#\#\#\#\#\#\# Print the coefficient for temp in the logridefit model 74 \#\#\#\#\#\#\# using the same strategy used in Q2C. 75 coef(logridefit) [ "temp"]) 76 77 \# CG Q4d \# Based on the temp coefficient from log ridefit, 78 \#\#\#\#\#\#\# do we expect ride count to increase 79 \#\#\#\#\#\#\# or decrease with an increase in temperature? 80 \#\#\#\#\#\#\# If log ride count is expected to increae with temperature, 81 \#\#\#\#\#\#\# type paste("increase"), otherwise paste("decrease"). 82 paste ("decrease") 83 84 \#CG Q4e \# Now print the multiplicative effect of temperature 85 \#\#\#\#\#\#\# on expected ride count by wrapping the line of code 86.\#\#\#\#\#\#\# from Q4c in the exp() function. 87 exp(coef(logridefit)[ "temp" ])) 88 89 \#CG Q4f \# Find the R-squared for the logridefit regression. 98 \#\#\#\#\#\#\# In your calculation, use logridefitsdeviance and \# CG Q5a \# Now, run a linear regression using log ride counts as the response 99 \#\#\#\#\#\# modeled by the weather variables weathersit, log (temp), hum, and windsp 100 \#\#\#\#\#\# Note the log() on the temp predictor. 101 \#\#\#\#\#\# Name your model loglogfit. 102 loglogfitlm(log(cnt)weathersit+log(temp)+ hum +windspeed, data = bikes) 104 \#CG Q5b \# Use summary() on your fitted model to print the results. 105 summary (loglogfit) 106 107 \# CG Q5C \# How does expected percent ride count change with a 108 \#\#\#\#\#\#\# 1\% increase in temperature? 109 \#\#\#\#\#\#\# Print the coefficient for log (temp) in the loglogfit model 110 \#\#\#\#\#\#\# using the same strategy used in Q2c. 111 coef (loglogfit)["log( temp )"] 113 \#CG Q5d \# Based on the log( temp) coefficient from loglogfit, 114 \#\#\#\#\#\#\# do we expect a percent increase or decrease in 115 \#\#\#\#\#\#\# ride count for each 1% increase in temperature? 116 \#\#\#\#\#\#\# If a percent increase is expected, type paste("increase") 117 \#\#\#\#\#\#\# otherwise paste("decrease") 118 if (coef(loglogfit) ["log(temp)"]>e\{paste ("increase") 119 else ( paste ("decrease") ) 120 \#CG Q5e \# Find the R-squared for the loglogfit regression. 121 \#\#\#\#\#\#\# In your calculation, use loglogfit\$deviance and 122 \#\#\#\#\#\#\# loglogfitsnu11. deviance and not the numbers printed 123 \#\#\#\#\#\#\# in the summary output for these. 121 \#\#\#\#\#\#\# In your calculation, use loglogfitsdeviance and 122 \#\#\#\#\#\#\# loglogfitsnu11. deviance and not the numbers printed 123 \#\#\#\#\#\#\# in the summary output for these. 1241 - loglogfit\$deviance/loglogfit\$nulldeviance 125 126 \# Question 6 -Let's practice making predictions of the response variable. 127 128 \#CG Q6a \# We' 11 make predictions using al1 3 competing models for 129. \#\#\#\#\#\#\# a wet day that is 25 degrees, has 50% humidity and windspeed of 5. 130 \#\#\#\#\#\#\# Make a data frame of these values and call it newdata. 131 newdatas - data. frame(weathersit=2) 132 133 \# CG Q6b \# Now use ridefit model to predict ride count using 134 \#\#\#\#\#\#\# the predict() function with your newdata object. 135 136 \# CG Q6C \# Now use the logridefit model to predict log ride count using 137 \#\#\#\#\#\#\# the predict() function with your newdata object. 138 139 \# CG Q6d \# To put the prediction of the log ride count back onto the raw 146 \#\#\#\#\#\#\# ride count scale, wrap the line of code from Q6c in the exp() 141 \#\#\#\#\#\#\# function to "undo" the log toansformation. 142 143 \# CG Q6e \# use the loglogfit model to predict log ride count using 144 \#\#\#\#\#\#\# the predict() function with your newdata object. 145 146 \# CG Q6f \# To put the prediction of the log ride count back onto the raw 147 \#\#\#\#\#\#\# ride count scale, wrap the 1 ine of code from Q6e in the exp() 148 \#\#\#\#\#\#\# function to "undo" the log transformation
Step by Step Solution
There are 3 Steps involved in it

Get step-by-step solutions from verified subject matter experts