

Question: 1. Checkout time at a supermarket is monitored using a mean and a range chart. Six samples of n=20 observations have been obtained and the
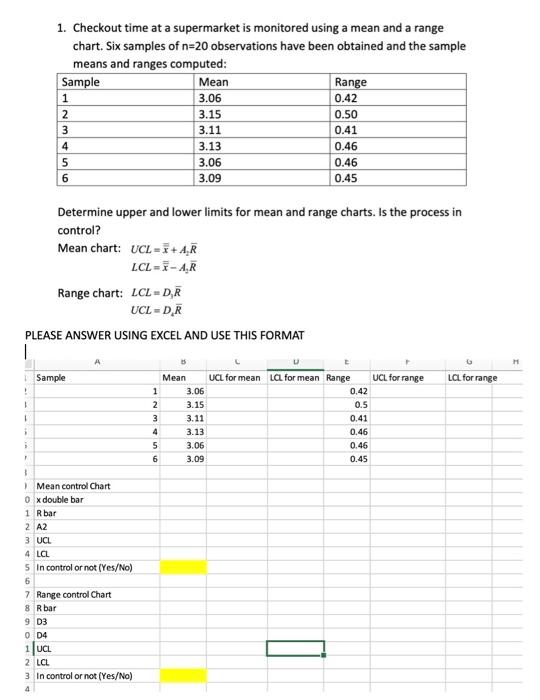
1. Checkout time at a supermarket is monitored using a mean and a range chart. Six samples of n=20 observations have been obtained and the sample means and ranges computed: Determine upper and lower limits for mean and range charts. Is the process in control? Mean chart: UCL=x+A2R LCL=xA2R Range chart: LCL=D3R UCL=D4R PLEASE ANSWER USING EXCEL AND USE THIS FORMAT
Step by Step Solution
There are 3 Steps involved in it
1 Expert Approved Answer
Step: 1 Unlock

Question Has Been Solved by an Expert!
Get step-by-step solutions from verified subject matter experts
Step: 2 Unlock
Step: 3 Unlock