

Question: Make these two in Excel please if you can. Thank you 1. Checkout time at a supermarket is monitored using a mean and a range
Make these two in Excel please if you can. Thank you
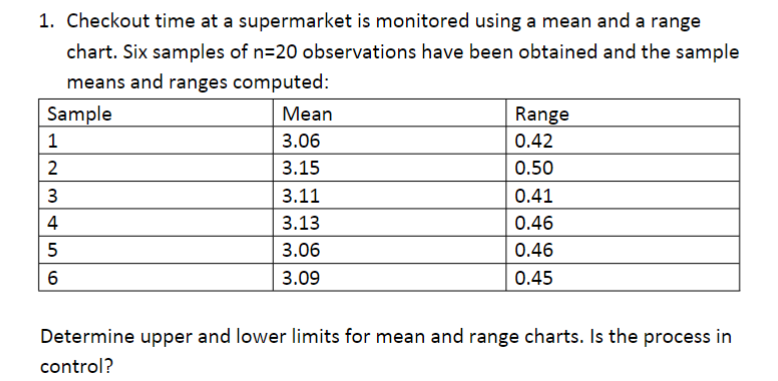
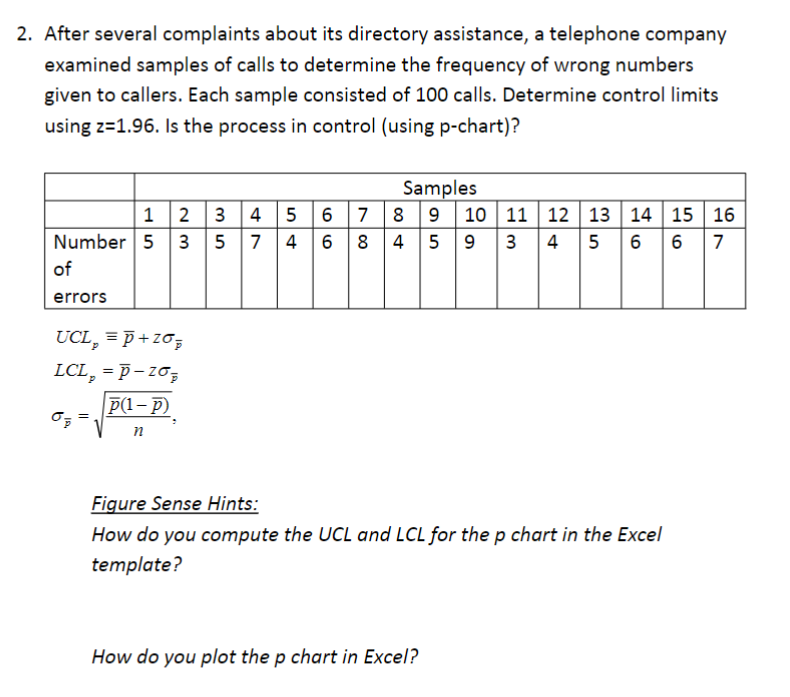
1. Checkout time at a supermarket is monitored using a mean and a range chart. Six samples of n=20 observations have been obtained and the sample means and ranges computed: Determine upper and lower limits for mean and range charts. Is the process in control? After several complaints about its directory assistance, a telephone company examined samples of calls to determine the frequency of wrong numbers given to callers. Each sample consisted of 100 calls. Determine control limits using z=1.96. Is the process in control (using p-chart)? UCLpp+zpLCLp=pzpp=np(1p) Figure Sense Hints: How do you compute the UCL and LCL for the p chart in the Excel template? How do you plot the p chart in Excel
Step by Step Solution
There are 3 Steps involved in it

Get step-by-step solutions from verified subject matter experts