Question: 1. Choose a PEPPER Target Area, Facility and State Assignment: Septicemia/Maimonides Medical Center (330194)/NY 2. Review your chosen PEPPER Target Area. What is this target
1. Choose a PEPPER Target Area, Facility and State Assignment:
Septicemia/Maimonides Medical Center (330194)/NY
2. Review your chosen PEPPER Target Area. What is this target measuring? Why is this target important to monitor? What is this target trying to prevent?
3. Calculate the assigned PEPPER Target Area using data for your assigned hospital.
4. Compare your facility's data to that of your assigned state and the nation.
5. make a small report for the coding manager. Include the information from step 3 as well as data insights
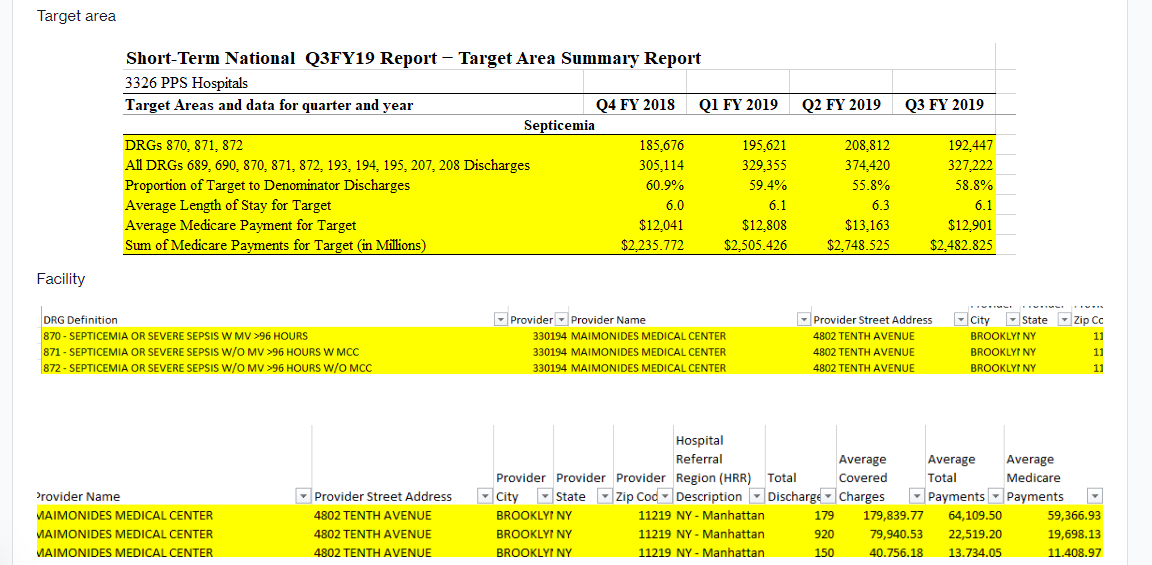
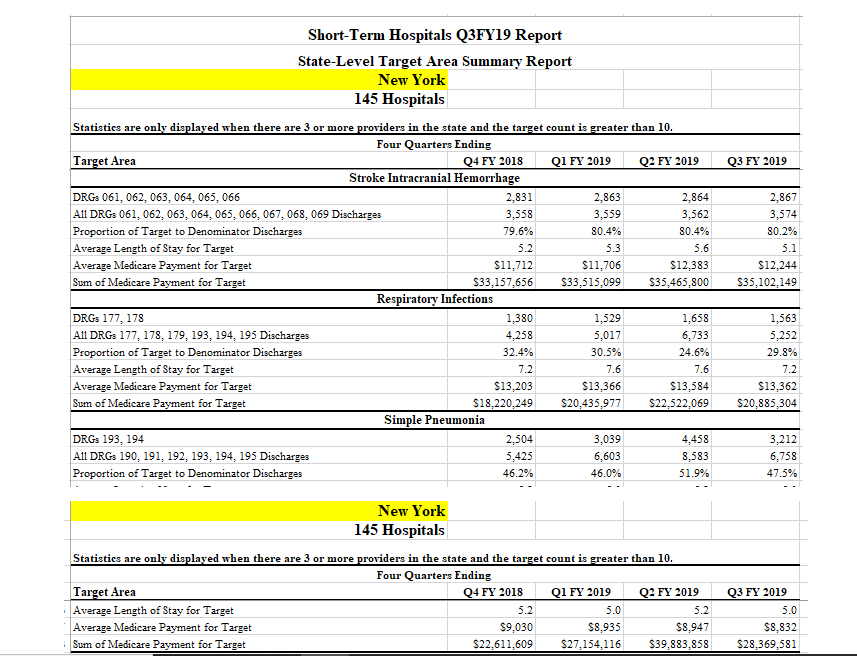
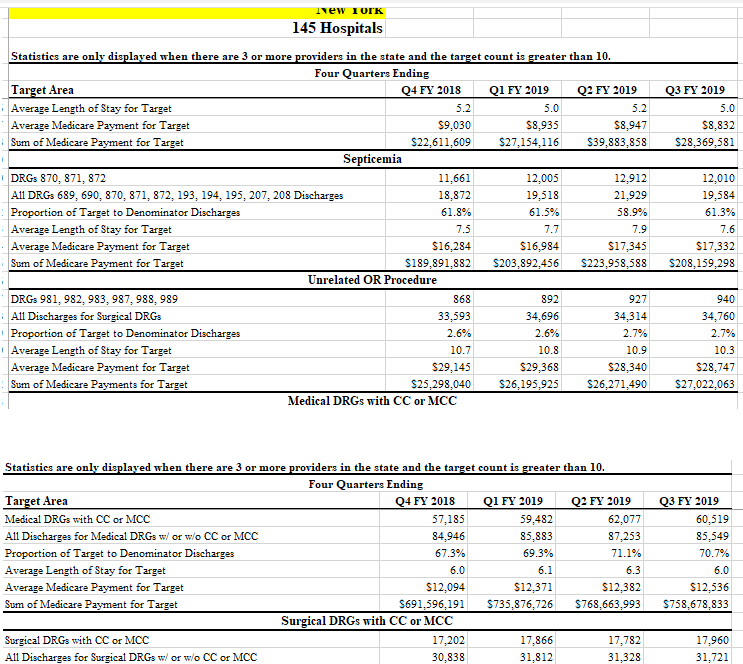
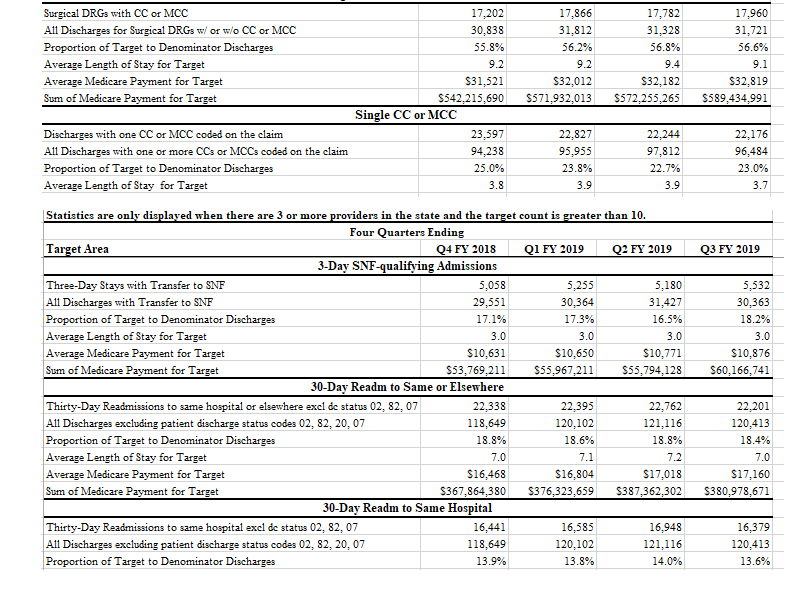
Target area Q3 FY 2019 Short-Term National Q3FY19 Report - Target Area Summary Report 3326 PPS Hospitals Target Areas and data for quarter and year Q4 FY 2018 Q1 FY 2019 Q2 FY 2019 Septicemia DRGs 870.871, 872 185,676 195,621 208,812 All DRGs 689, 690, 870.871, 872, 193, 194, 195, 207, 208 Discharges 305,114 329,355 374,420 Proportion of Target to Denominator Discharges 60.9% 59.4% 55.8% Average Length of Stay for Target 6.0 6.1 6.3 Average Medicare Payment for Target $12,041 $12,808 $13,163 Sum of Medicare Payments for Target (in Millions) $2.235.772 $2,505.426 $2,748.525 192,447 327,222 58.8% 6.1 $12,901 $2,482.825 Facility DRG Definition 870 - SEPTICEMIA OR SEVERE SEPSIS WMV >96 HOURS 871 - SEPTICEMIA OR SEVERE SEPSIS W/O MV >96 HOURS W MCC 872 - SEPTICEMIA OR SEVERE SEPSIS W/O MV >96 HOURS W/O MCC - Provider - Provider Name 330194 MAIMONIDES MEDICAL CENTER 330194 MAIMONIDES MEDICAL CENTER 330194 MAIMONIDES MEDICAL CENTER Provider Street Address 4802 TENTH AVENUE 4802 TENTH AVENUE 4802 TENTH AVENUE City State - Zip Cc BROOKLYI NY 11 BROOKLYI NY 11 BROOKLYI NY 11 Provider Name MAIMONIDES MEDICAL CENTER MAIMONIDES MEDICAL CENTER VAIMONIDES MEDICAL CENTER - Provider Street Address 4802 TENTH AVENUE 4802 TENTH AVENUE 4802 TENTH AVENUE Hospital Referral Average Average Average Provider Provider Provider Region (HRR) Total Covered Total Medicare C City State Zip Cod Description Discharge Charges Payments Payments - BROOKLYI NY 11219 NY - Manhattan 179 179,839.77 64,109.50 59,366.93 BROOKLYI NY 11219 NY - Manhattan 920 79,940.53 22,519.20 19,698.13 BROOKLYI NY 11219 NY - Manhattan 150 40.756.18 13.734.05 11.408.97 Q3 FY 2019 Short-Term Hospitals Q3FY19 Report State-Level Target Area Summary Report New York 145 Hospitals Statistics are only displayed when there are 3 or more providers in the state and the target count is greater than 10. Four Quarters Ending Target Area Q4 FY 2018 QI FY 2019 Q2 FY 2019 Stroke Intracranial Hemorrhage DRGs 061, 062, 063, 064, 065, 066 2,831 2,863 2.864 A11 DRGs 061, 062, 063, 064,065, 066,067,068, 069 Discharges 3,558 3,559 3,562 Proportion of Target to Denominator Discharges 79.6% 80.4% 80.4% Average Length of Stay for Target 5.2 5.3 5.6 Average Medicare Payment for Target $11,712 $11,706 $12,383 Sum of Medicare Payment for Target $33,157,656 $33,515,099 $35,465,800 Respiratory Infections DRGs 177, 178 1,380 1,529 1,658 All DRGs 177, 178, 179, 193, 194, 195 Discharges 4.258 5,017 6,733 Proportion of Target to Denominator Discharges 32.4% 30.5% 24.6% Average Length of Stay for Target 7.2 7.6 7.6 Average Medicare Payment for Target $13,203 $13,366 $13,584 Sum of Medicare Payment for Target $18,220,249 $20.435,977 $22,522,069 Simple Pneumonia DRGs 193, 194 2,504 3,039 4,458 A11 DRGs 190, 191, 192, 193, 194, 195 Discharges 5,425 6,603 8,583 Proportion of Target to Denominator Discharges 46.2% 46.0% 51.9% 2.867 3,574 80.2% 5.1 $12,244 $35,102,149 1,563 5,252 29.8% 7.2 $13,362 $20,885,304 3,212 6,758 47.5% New York 145 Hospitals Statistics are only displayed when there are 3 or more providers in the state and the target count is greater than 10. Four Quarters Ending Target Area Q4 FY 2018 QI FY 2019 Q2 FY 2019 Average Length of Stay for Target 5.2 5.0 5.2 Average Medicare Payment for Target $9,030 $8,935 $8,947 Sum of Medicare Payment for Target $22,611,609 $27,154,116 $39,883,858 Q3 FY 2019 5.0 $8,832 $28,369,581 Q3 FY 2019 5.0 $8,832 $28,369,581 1 New York 145 Hospitals Statistics are only displayed when there are 3 or more providers in the state and the target count is greater than 10. Four Quarters Ending Target Area Q4 FY 2018 QI FY 2019 Q2 FY 2019 i Average Length of Stay for Target 5.2 5.0 5.2 Average Medicare Payment for Target $9.030 $8,935 $8.947 Sum of Medicare Payment for Target $22,611,609 $27,154,116 $39.883,858 Septicemia DRGs 370, 371, 372 11,661 12,005 12,912 A11 DRGs 689,690, 870,871, 372, 193, 194, 195, 207, 208 Discharges 18,872 19,518 21,929 Proportion of Target to Denominator Discharges 61.8% 61.5% 58.9% Average Length of Stay for Target 7.5 7.7 7.9 Average Medicare Payment for Target $16,284 $16,984 $17,345 Sum of Medicare Payment for Target $189,891,882 $203,892,456 $223,958,588 Unrelated OR Procedure DRGs 981,982,983,987,988,989 868 892 927 All Discharges for Surgical DRGs 33,593 34.696 34,314 Proportion of Target to Denominator Discharges 2.6% 2.6% 2.7% Average Length of Stay for Target 10.7 10.8 10.9 Average Medicare Payment for Target $29,145 $29,368 $28,340 Sum of Medicare Payments for Target $25,298,040 $26.195.925 $26,271,490 Medical DRGs with CC or MCC 12,010 19,584 61.3% 7.6 $17,332 S208, 159,298 940 34,760 2.7% 10.3 $28,747 $27,022,063 Statistics are only displayed when there are 3 or more providers in the state and the target count is greater than 10. Four Quarters Ending Target Area Q4 FY 2018 QI FY 2019 Q2 FY 2019 Medical DRGs with CC or MCC 57,185 59,482 62,077 All Discharges for Medical DRGs w/ or w/o CC or MCC 84,946 85,883 87,253 Proportion of Target to Denominator Discharges 67.3% 69.3% 71.1% Average Length of Stay for Target 6.0 6.1 6.3 Average Medicare Payment for Target $12,094 $12,371 $12,382 Sum of Medicare Payment for Target $691,596,191 $735,876,726 $768,663,993 Surgical DRGs with CC or MCC Surgical DRGs with CC or MCC 17,202 17,866 17,782 A11 Discharges for Surgical DRGs w/ or w/o CC or MCC 30,838 31,812 31.328 Q3 FY 2019 60,519 85,549 70.7% 6.0 $12,536 $758,678,833 17,960 31,721 Surgical DRGs with CC or MCC All Discharges for Surgical DRGs w/ or w/o CC or MCC Proportion of Target to Denominator Discharges Average Length of Stay for Target Average Medicare Payment for Target Sum of Medicare Payment for Target 17,202 30,838 55.8% 9.2 $31,521 S542,215,690 Single CC or MCC 23,597 94,238 25.0% 3.8 17,866 31,812 56.2% 9.2 $32,012 $571,932,013 17,782 31,328 56.8% 9.4 $32,182 $572,255,265 17,960 31,721 56.6% 9.1 $32,819 $589,434,991 Discharges with one CC or MCC coded on the claim All Discharges with one or more CCs or MCCs coded on the claim Proportion of Target to Denominator Discharges Average Length of Stay for Target 22.827 95,955 23.8% 3.9 22.244 97.812 22.7% 3.9 22,176 96,484 23.0% 3.7 Q3 FY 2019 5,532 30,363 18.2% 3.0 $10,876 $60,166,741 Statistics are only displayed when there are 3 or more providers in the state and the target count is greater than 10. Four Quarters Ending Target Area Q4 FY 2018 QI FY 2019 Q2 FY 2019 3-Day SNF-qualifying Admissions Three-Day Stays with Transfer to SNF 5,058 5,255 5,180 A11 Discharges with Transfer to SNF 29,551 30,364 31,427 Proportion of Target to Denominator Discharges 17.1% 17.3% 16.5% Average Length of Stay for Target 3.0 3.0 3.0 Average Medicare Payment for Target $10,631 $10,650 $10,771 Sum of Medicare Payment for Target $53,769,211 $55,967,211 $55,794,128 30-Day Readm to Same or Elsewhere Thirty-Day Readmissions to same hospital or elsewhere excl de status 02, 82,07 22,338 22,395 22,762 A11 Discharges excluding patient discharge status codes 02, 82, 20.07 118,649 120,102 121,116 Proportion of Target to Denominator Discharges 18.8% 18.6% 18.8% Average Length of Stay for Target 7.0 7.1 7.2 Average Medicare Payment for Target $16,468 $16,804 $17,018 Sum of Medicare Payment for Target $367.864,380 $376,323,659 $387,362,302 30-Day Readm to Same Hospital Thirty-Day Readmissions to same hospital excl de status 02, 82,07 16,441 16,585 16,948 A11 Discharges excluding patient discharge status codes 02, 82, 20.07 118,649 120,102 121,116 Proportion of Target to Denominator Discharges 13.9% 13.8% 14.0% 22,201 120,413 18.4% 7.0 $17,160 $380,978,671 16,379 120,413 13.6% Target area Q3 FY 2019 Short-Term National Q3FY19 Report - Target Area Summary Report 3326 PPS Hospitals Target Areas and data for quarter and year Q4 FY 2018 Q1 FY 2019 Q2 FY 2019 Septicemia DRGs 870.871, 872 185,676 195,621 208,812 All DRGs 689, 690, 870.871, 872, 193, 194, 195, 207, 208 Discharges 305,114 329,355 374,420 Proportion of Target to Denominator Discharges 60.9% 59.4% 55.8% Average Length of Stay for Target 6.0 6.1 6.3 Average Medicare Payment for Target $12,041 $12,808 $13,163 Sum of Medicare Payments for Target (in Millions) $2.235.772 $2,505.426 $2,748.525 192,447 327,222 58.8% 6.1 $12,901 $2,482.825 Facility DRG Definition 870 - SEPTICEMIA OR SEVERE SEPSIS WMV >96 HOURS 871 - SEPTICEMIA OR SEVERE SEPSIS W/O MV >96 HOURS W MCC 872 - SEPTICEMIA OR SEVERE SEPSIS W/O MV >96 HOURS W/O MCC - Provider - Provider Name 330194 MAIMONIDES MEDICAL CENTER 330194 MAIMONIDES MEDICAL CENTER 330194 MAIMONIDES MEDICAL CENTER Provider Street Address 4802 TENTH AVENUE 4802 TENTH AVENUE 4802 TENTH AVENUE City State - Zip Cc BROOKLYI NY 11 BROOKLYI NY 11 BROOKLYI NY 11 Provider Name MAIMONIDES MEDICAL CENTER MAIMONIDES MEDICAL CENTER VAIMONIDES MEDICAL CENTER - Provider Street Address 4802 TENTH AVENUE 4802 TENTH AVENUE 4802 TENTH AVENUE Hospital Referral Average Average Average Provider Provider Provider Region (HRR) Total Covered Total Medicare C City State Zip Cod Description Discharge Charges Payments Payments - BROOKLYI NY 11219 NY - Manhattan 179 179,839.77 64,109.50 59,366.93 BROOKLYI NY 11219 NY - Manhattan 920 79,940.53 22,519.20 19,698.13 BROOKLYI NY 11219 NY - Manhattan 150 40.756.18 13.734.05 11.408.97 Q3 FY 2019 Short-Term Hospitals Q3FY19 Report State-Level Target Area Summary Report New York 145 Hospitals Statistics are only displayed when there are 3 or more providers in the state and the target count is greater than 10. Four Quarters Ending Target Area Q4 FY 2018 QI FY 2019 Q2 FY 2019 Stroke Intracranial Hemorrhage DRGs 061, 062, 063, 064, 065, 066 2,831 2,863 2.864 A11 DRGs 061, 062, 063, 064,065, 066,067,068, 069 Discharges 3,558 3,559 3,562 Proportion of Target to Denominator Discharges 79.6% 80.4% 80.4% Average Length of Stay for Target 5.2 5.3 5.6 Average Medicare Payment for Target $11,712 $11,706 $12,383 Sum of Medicare Payment for Target $33,157,656 $33,515,099 $35,465,800 Respiratory Infections DRGs 177, 178 1,380 1,529 1,658 All DRGs 177, 178, 179, 193, 194, 195 Discharges 4.258 5,017 6,733 Proportion of Target to Denominator Discharges 32.4% 30.5% 24.6% Average Length of Stay for Target 7.2 7.6 7.6 Average Medicare Payment for Target $13,203 $13,366 $13,584 Sum of Medicare Payment for Target $18,220,249 $20.435,977 $22,522,069 Simple Pneumonia DRGs 193, 194 2,504 3,039 4,458 A11 DRGs 190, 191, 192, 193, 194, 195 Discharges 5,425 6,603 8,583 Proportion of Target to Denominator Discharges 46.2% 46.0% 51.9% 2.867 3,574 80.2% 5.1 $12,244 $35,102,149 1,563 5,252 29.8% 7.2 $13,362 $20,885,304 3,212 6,758 47.5% New York 145 Hospitals Statistics are only displayed when there are 3 or more providers in the state and the target count is greater than 10. Four Quarters Ending Target Area Q4 FY 2018 QI FY 2019 Q2 FY 2019 Average Length of Stay for Target 5.2 5.0 5.2 Average Medicare Payment for Target $9,030 $8,935 $8,947 Sum of Medicare Payment for Target $22,611,609 $27,154,116 $39,883,858 Q3 FY 2019 5.0 $8,832 $28,369,581 Q3 FY 2019 5.0 $8,832 $28,369,581 1 New York 145 Hospitals Statistics are only displayed when there are 3 or more providers in the state and the target count is greater than 10. Four Quarters Ending Target Area Q4 FY 2018 QI FY 2019 Q2 FY 2019 i Average Length of Stay for Target 5.2 5.0 5.2 Average Medicare Payment for Target $9.030 $8,935 $8.947 Sum of Medicare Payment for Target $22,611,609 $27,154,116 $39.883,858 Septicemia DRGs 370, 371, 372 11,661 12,005 12,912 A11 DRGs 689,690, 870,871, 372, 193, 194, 195, 207, 208 Discharges 18,872 19,518 21,929 Proportion of Target to Denominator Discharges 61.8% 61.5% 58.9% Average Length of Stay for Target 7.5 7.7 7.9 Average Medicare Payment for Target $16,284 $16,984 $17,345 Sum of Medicare Payment for Target $189,891,882 $203,892,456 $223,958,588 Unrelated OR Procedure DRGs 981,982,983,987,988,989 868 892 927 All Discharges for Surgical DRGs 33,593 34.696 34,314 Proportion of Target to Denominator Discharges 2.6% 2.6% 2.7% Average Length of Stay for Target 10.7 10.8 10.9 Average Medicare Payment for Target $29,145 $29,368 $28,340 Sum of Medicare Payments for Target $25,298,040 $26.195.925 $26,271,490 Medical DRGs with CC or MCC 12,010 19,584 61.3% 7.6 $17,332 S208, 159,298 940 34,760 2.7% 10.3 $28,747 $27,022,063 Statistics are only displayed when there are 3 or more providers in the state and the target count is greater than 10. Four Quarters Ending Target Area Q4 FY 2018 QI FY 2019 Q2 FY 2019 Medical DRGs with CC or MCC 57,185 59,482 62,077 All Discharges for Medical DRGs w/ or w/o CC or MCC 84,946 85,883 87,253 Proportion of Target to Denominator Discharges 67.3% 69.3% 71.1% Average Length of Stay for Target 6.0 6.1 6.3 Average Medicare Payment for Target $12,094 $12,371 $12,382 Sum of Medicare Payment for Target $691,596,191 $735,876,726 $768,663,993 Surgical DRGs with CC or MCC Surgical DRGs with CC or MCC 17,202 17,866 17,782 A11 Discharges for Surgical DRGs w/ or w/o CC or MCC 30,838 31,812 31.328 Q3 FY 2019 60,519 85,549 70.7% 6.0 $12,536 $758,678,833 17,960 31,721 Surgical DRGs with CC or MCC All Discharges for Surgical DRGs w/ or w/o CC or MCC Proportion of Target to Denominator Discharges Average Length of Stay for Target Average Medicare Payment for Target Sum of Medicare Payment for Target 17,202 30,838 55.8% 9.2 $31,521 S542,215,690 Single CC or MCC 23,597 94,238 25.0% 3.8 17,866 31,812 56.2% 9.2 $32,012 $571,932,013 17,782 31,328 56.8% 9.4 $32,182 $572,255,265 17,960 31,721 56.6% 9.1 $32,819 $589,434,991 Discharges with one CC or MCC coded on the claim All Discharges with one or more CCs or MCCs coded on the claim Proportion of Target to Denominator Discharges Average Length of Stay for Target 22.827 95,955 23.8% 3.9 22.244 97.812 22.7% 3.9 22,176 96,484 23.0% 3.7 Q3 FY 2019 5,532 30,363 18.2% 3.0 $10,876 $60,166,741 Statistics are only displayed when there are 3 or more providers in the state and the target count is greater than 10. Four Quarters Ending Target Area Q4 FY 2018 QI FY 2019 Q2 FY 2019 3-Day SNF-qualifying Admissions Three-Day Stays with Transfer to SNF 5,058 5,255 5,180 A11 Discharges with Transfer to SNF 29,551 30,364 31,427 Proportion of Target to Denominator Discharges 17.1% 17.3% 16.5% Average Length of Stay for Target 3.0 3.0 3.0 Average Medicare Payment for Target $10,631 $10,650 $10,771 Sum of Medicare Payment for Target $53,769,211 $55,967,211 $55,794,128 30-Day Readm to Same or Elsewhere Thirty-Day Readmissions to same hospital or elsewhere excl de status 02, 82,07 22,338 22,395 22,762 A11 Discharges excluding patient discharge status codes 02, 82, 20.07 118,649 120,102 121,116 Proportion of Target to Denominator Discharges 18.8% 18.6% 18.8% Average Length of Stay for Target 7.0 7.1 7.2 Average Medicare Payment for Target $16,468 $16,804 $17,018 Sum of Medicare Payment for Target $367.864,380 $376,323,659 $387,362,302 30-Day Readm to Same Hospital Thirty-Day Readmissions to same hospital excl de status 02, 82,07 16,441 16,585 16,948 A11 Discharges excluding patient discharge status codes 02, 82, 20.07 118,649 120,102 121,116 Proportion of Target to Denominator Discharges 13.9% 13.8% 14.0% 22,201 120,413 18.4% 7.0 $17,160 $380,978,671 16,379 120,413 13.6%


