

Question: 1. Compare the delay data in figures 2 & 5. a. Explain the data in each figure; b. Explain any differences between them and why
1. Compare the delay data in figures 2 & 5. a. Explain the data in each figure; b. Explain any differences between them and why this is the case.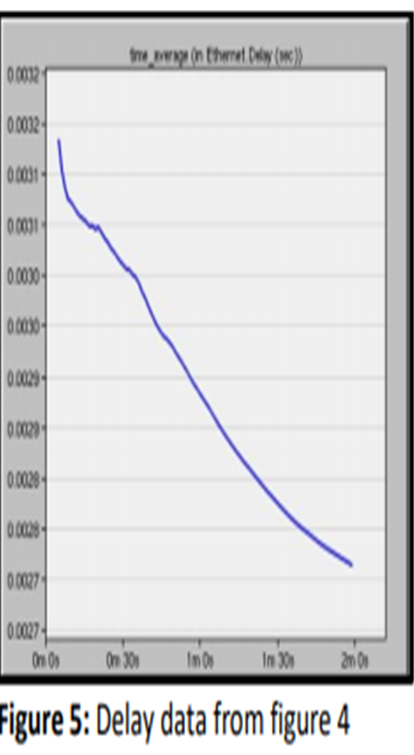
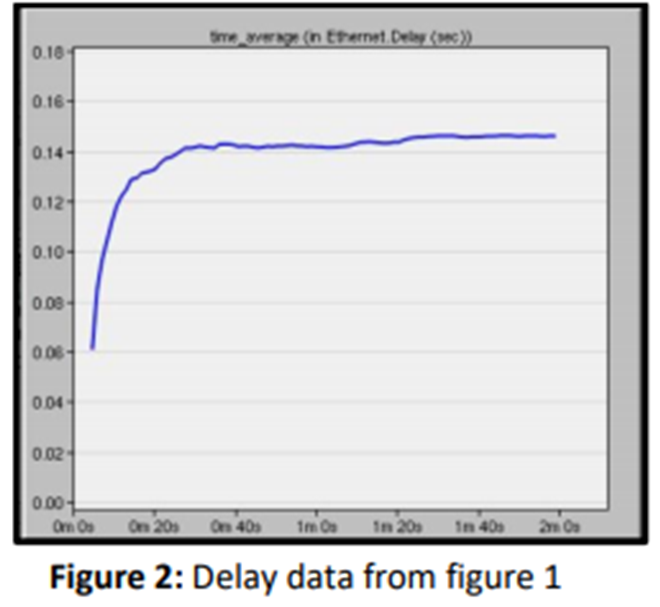
trawn in turat Day (wce) O CON 00032 0001 000 00000 000 000281 00020 0.0028 00008 00027 00027 Ons On 30 Inos In) Figure 5: Delay data from figure 4 te www in trenet. Dety()) 0.18 0.16- 0.14-1 0.121 0.10 0.08 008- 0.04 0.02 0.00 - Om os On 20 on 40 Ima in 20 in 40 anos Figure 2: Delay data from figure 1
Step by Step Solution
There are 3 Steps involved in it
1 Expert Approved Answer
Step: 1 Unlock

Question Has Been Solved by an Expert!
Get step-by-step solutions from verified subject matter experts
Step: 2 Unlock
Step: 3 Unlock