

Question: 1 . Comparing materials using measured data [ 2 0 pts ] The table below shows data collected for two materials: poly ( ethylene )
Comparing materials using measured data pts
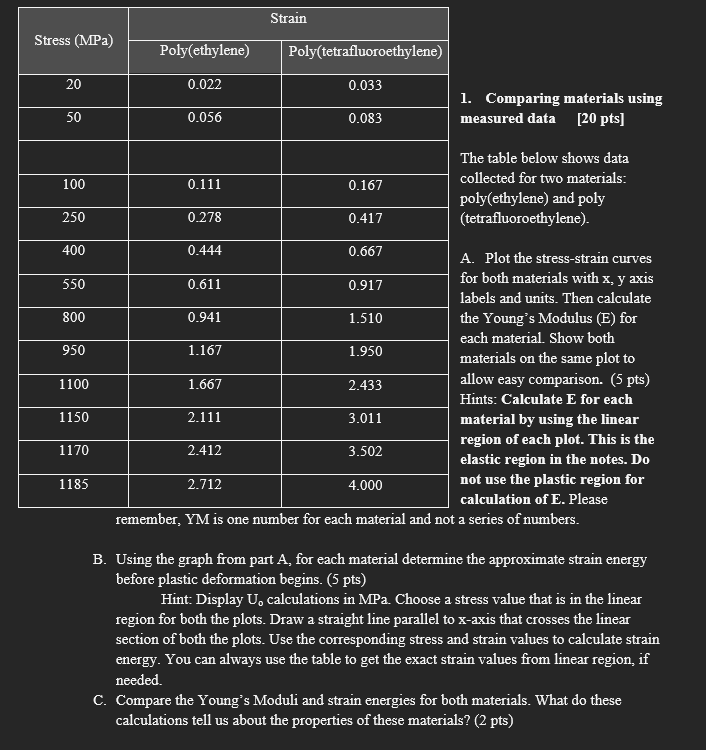
The table below shows data collected for two materials: polyethylene and poly tetrafluoroethylene
A Plot the stressstrain curves for both materials with mathrmxmathrmy axis labels and units. Then calculate the Young's Modulus E for each material. Show both materials on the same plot to allow easy comparison. pts Hints: Calculate E for each material by using the linear region of each plot. This is the elastic region in the notes. Do not use the plastic region for calculation of E Please
remember, YM is one number for each material and not a series of numbers.
B Using the graph from part A for each material determine the approximate strain energy before plastic deformation begins. pts
Hint: Display mathrmU calculations in MPa. Choose a stress value that is in the linear region for both the plots. Draw a straight line parallel to x axis that crosses the linear section of both the plots. Use the corresponding stress and strain values to calculate strain energy. You can always use the table to get the exact strain values from linear region, if needed.
C Compare the Young's Moduli and strain energies for both materials. What do these calculations tell us about the properties of these materials? pts
Step by Step Solution
There are 3 Steps involved in it
1 Expert Approved Answer
Step: 1 Unlock

Question Has Been Solved by an Expert!
Get step-by-step solutions from verified subject matter experts
Step: 2 Unlock
Step: 3 Unlock