

Question: Friction EXPLORATION EXPERIMENTATION EVALUATION Exercise 1 Measuring Static and Kinetic Friction Need Help? In this exercise you will measure the forces and coefficients of static
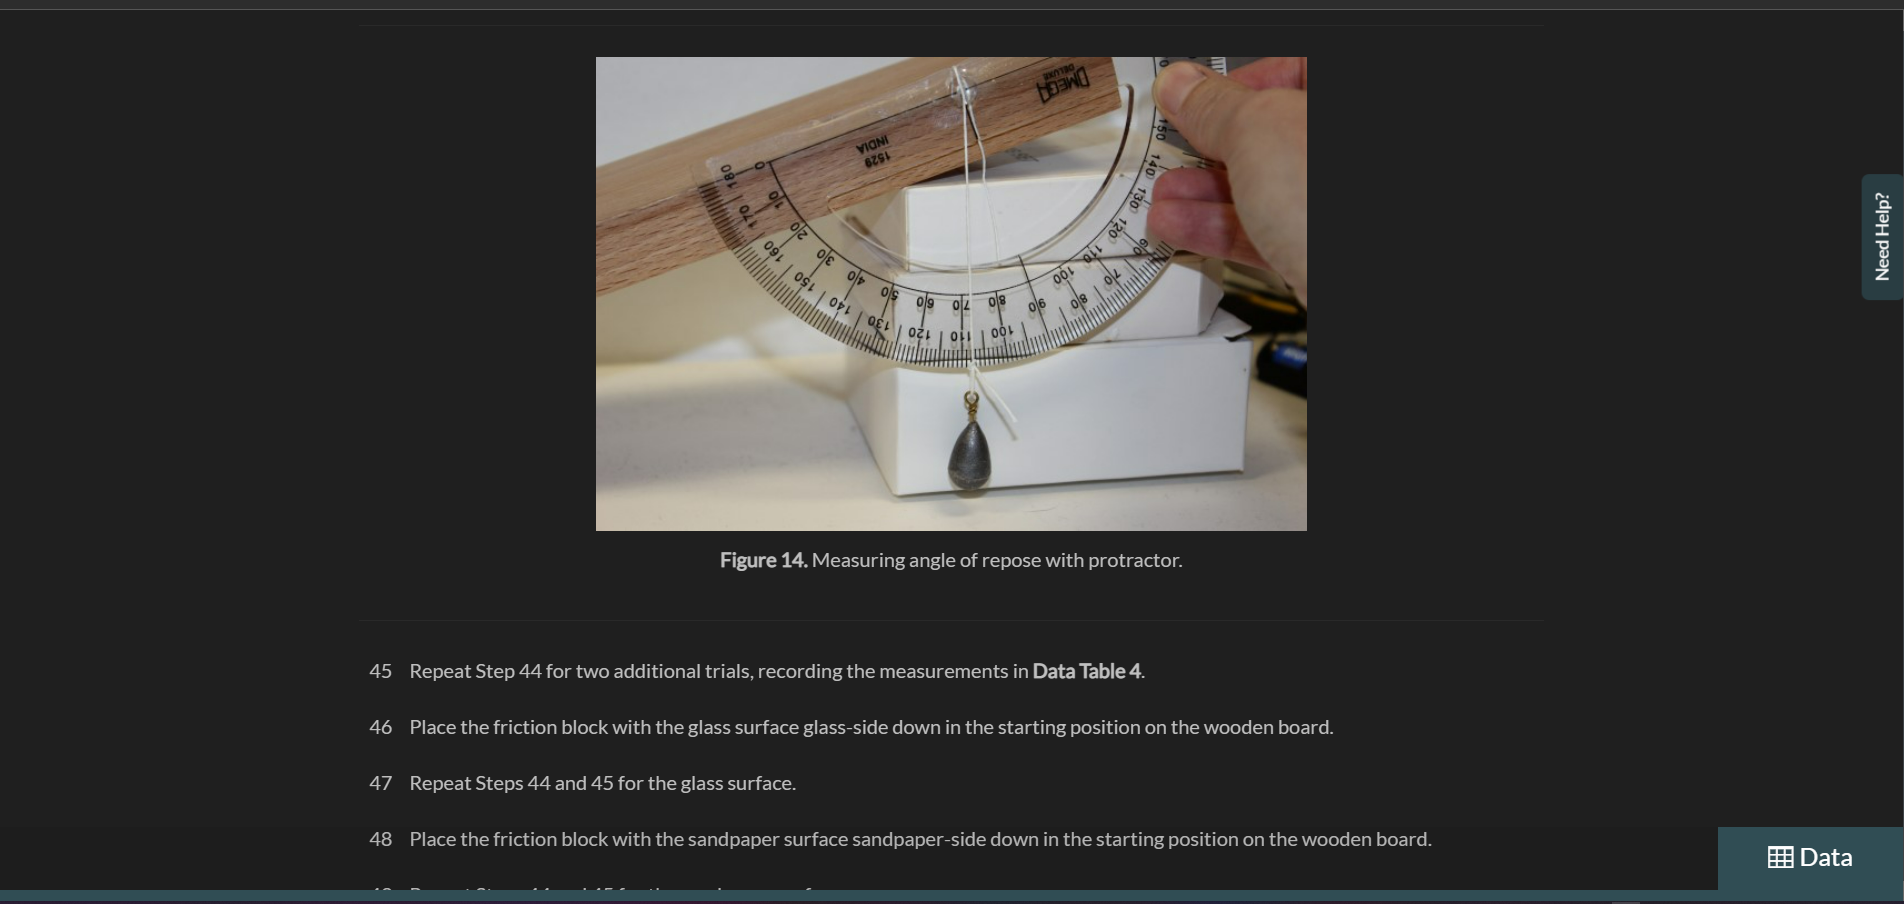
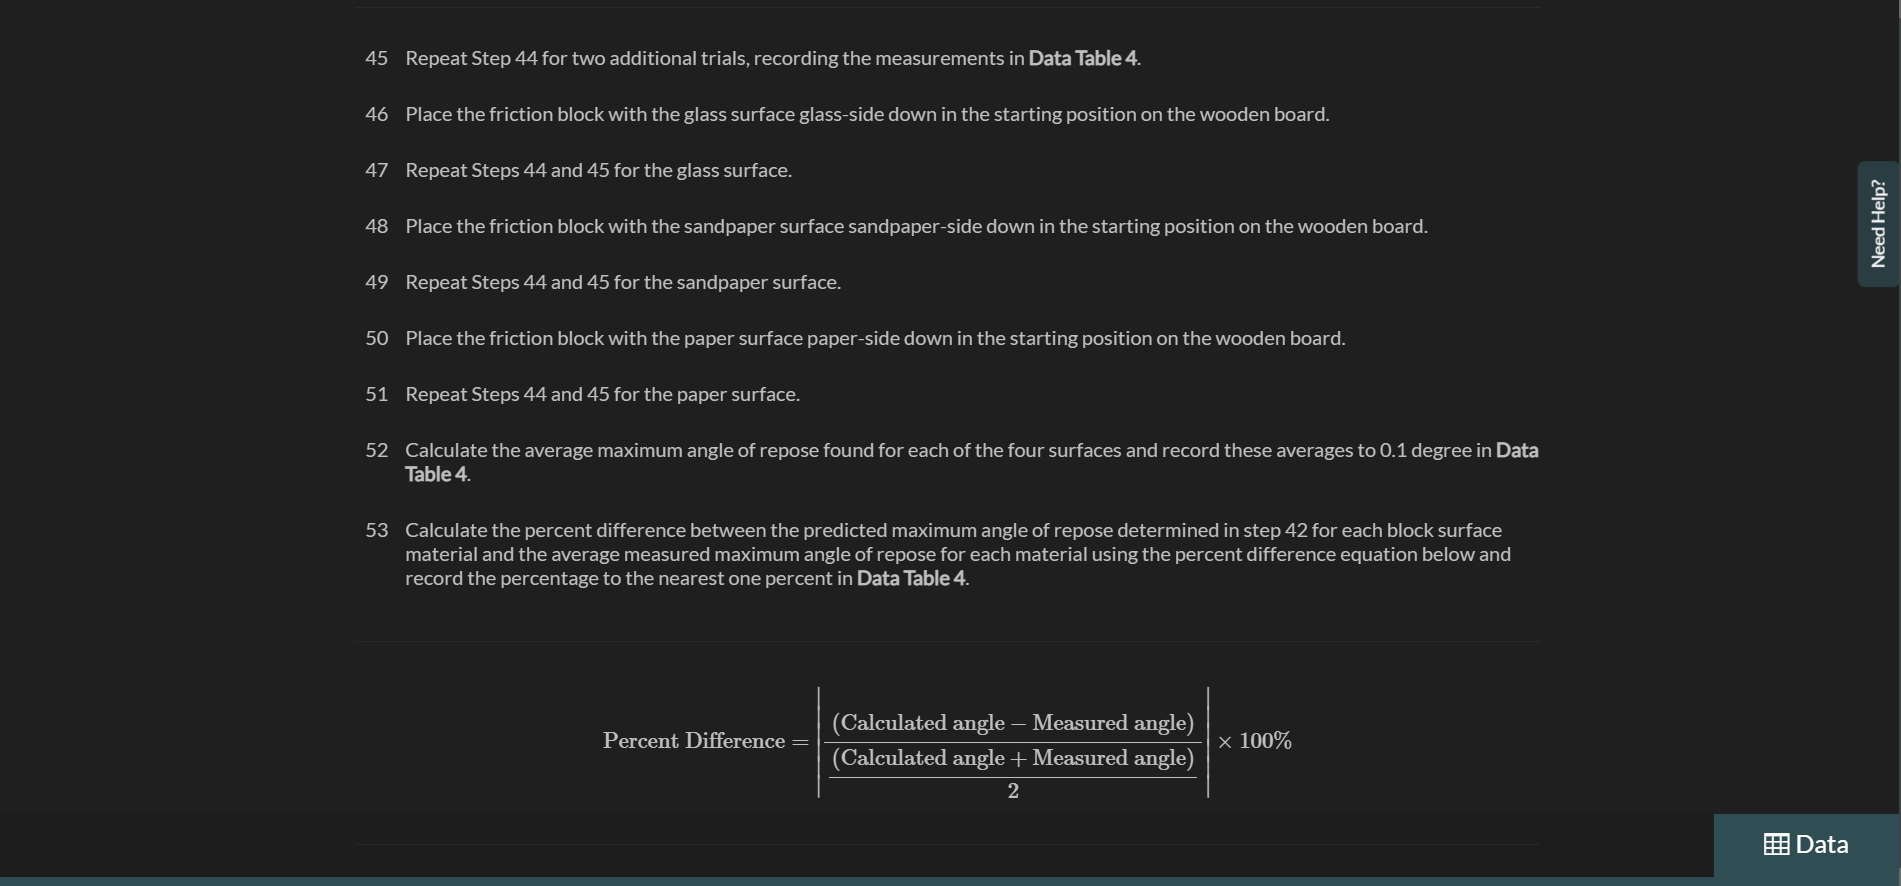
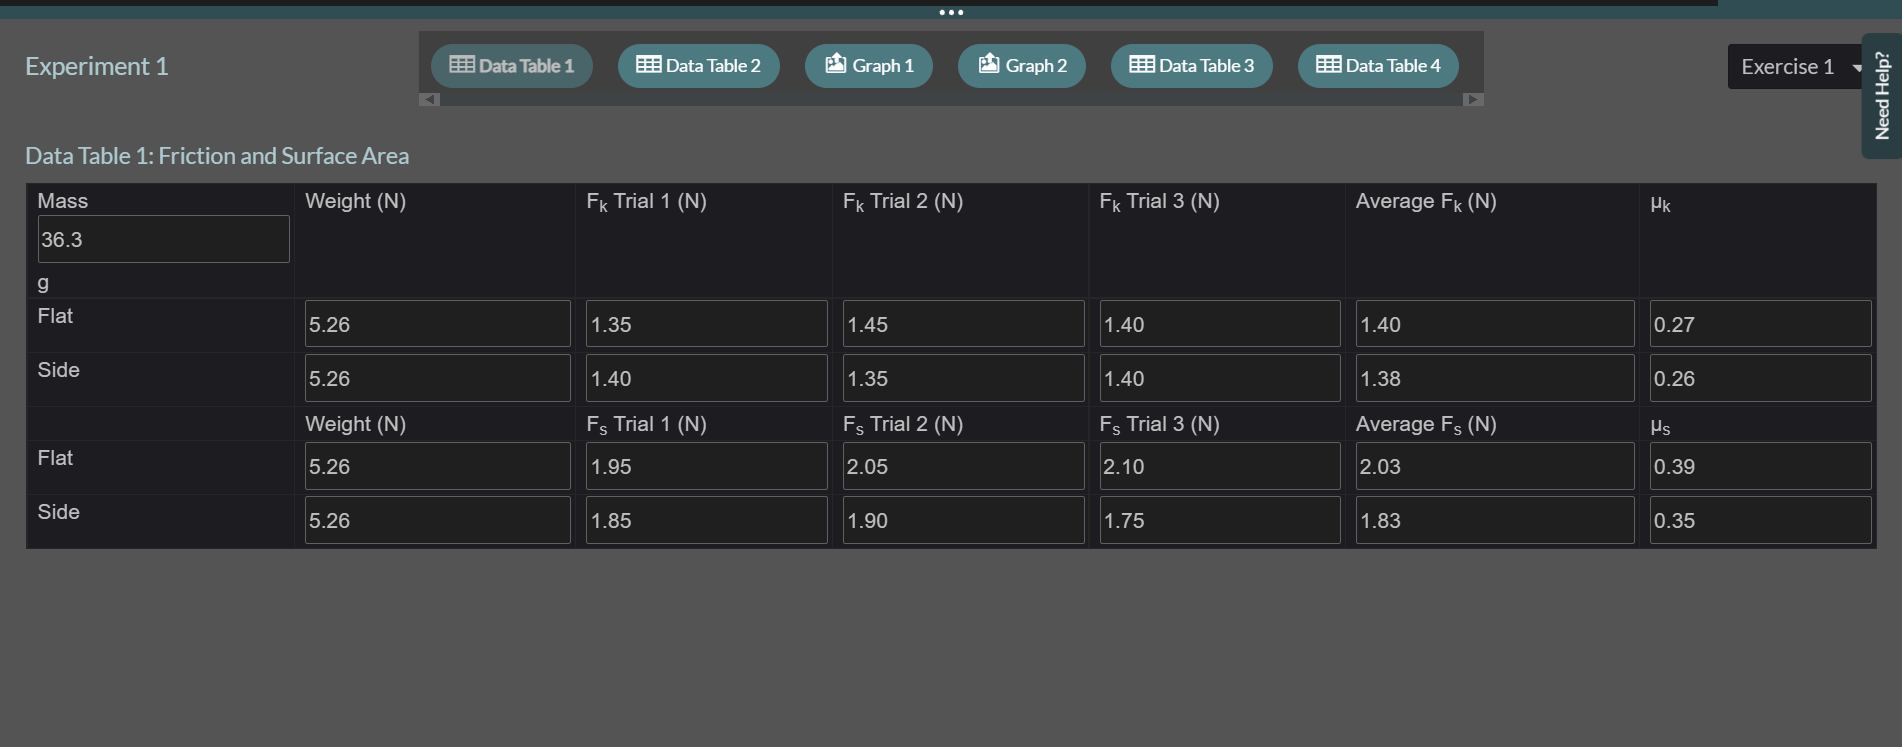


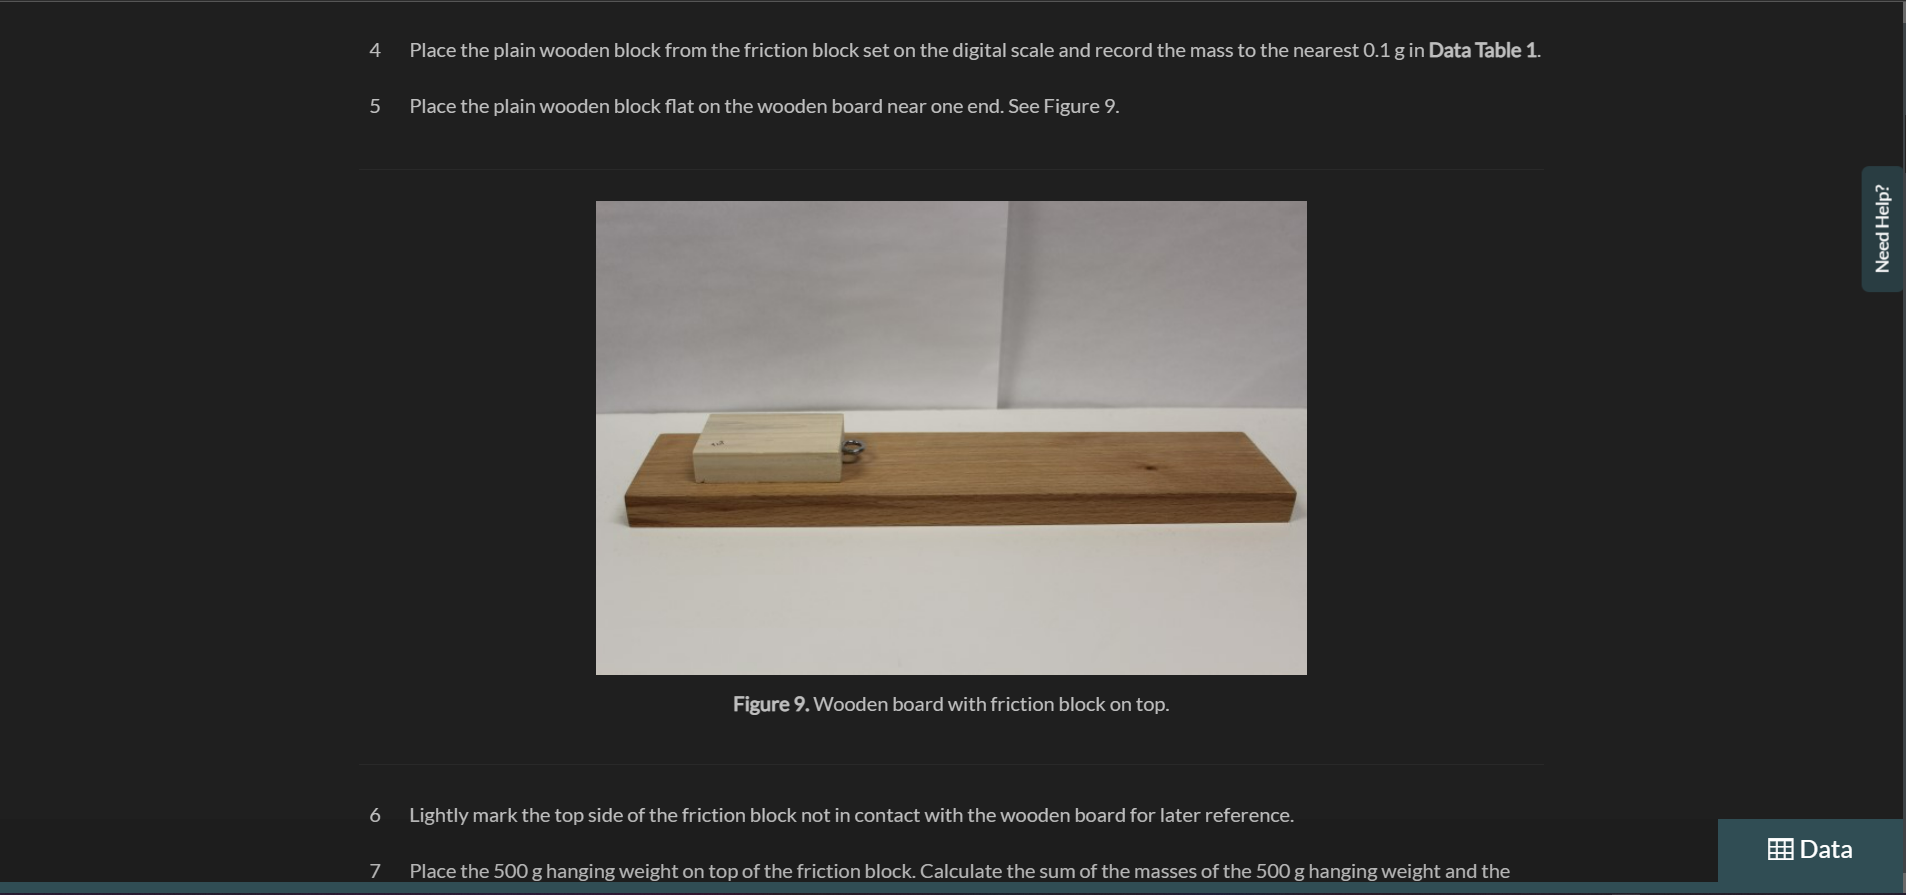


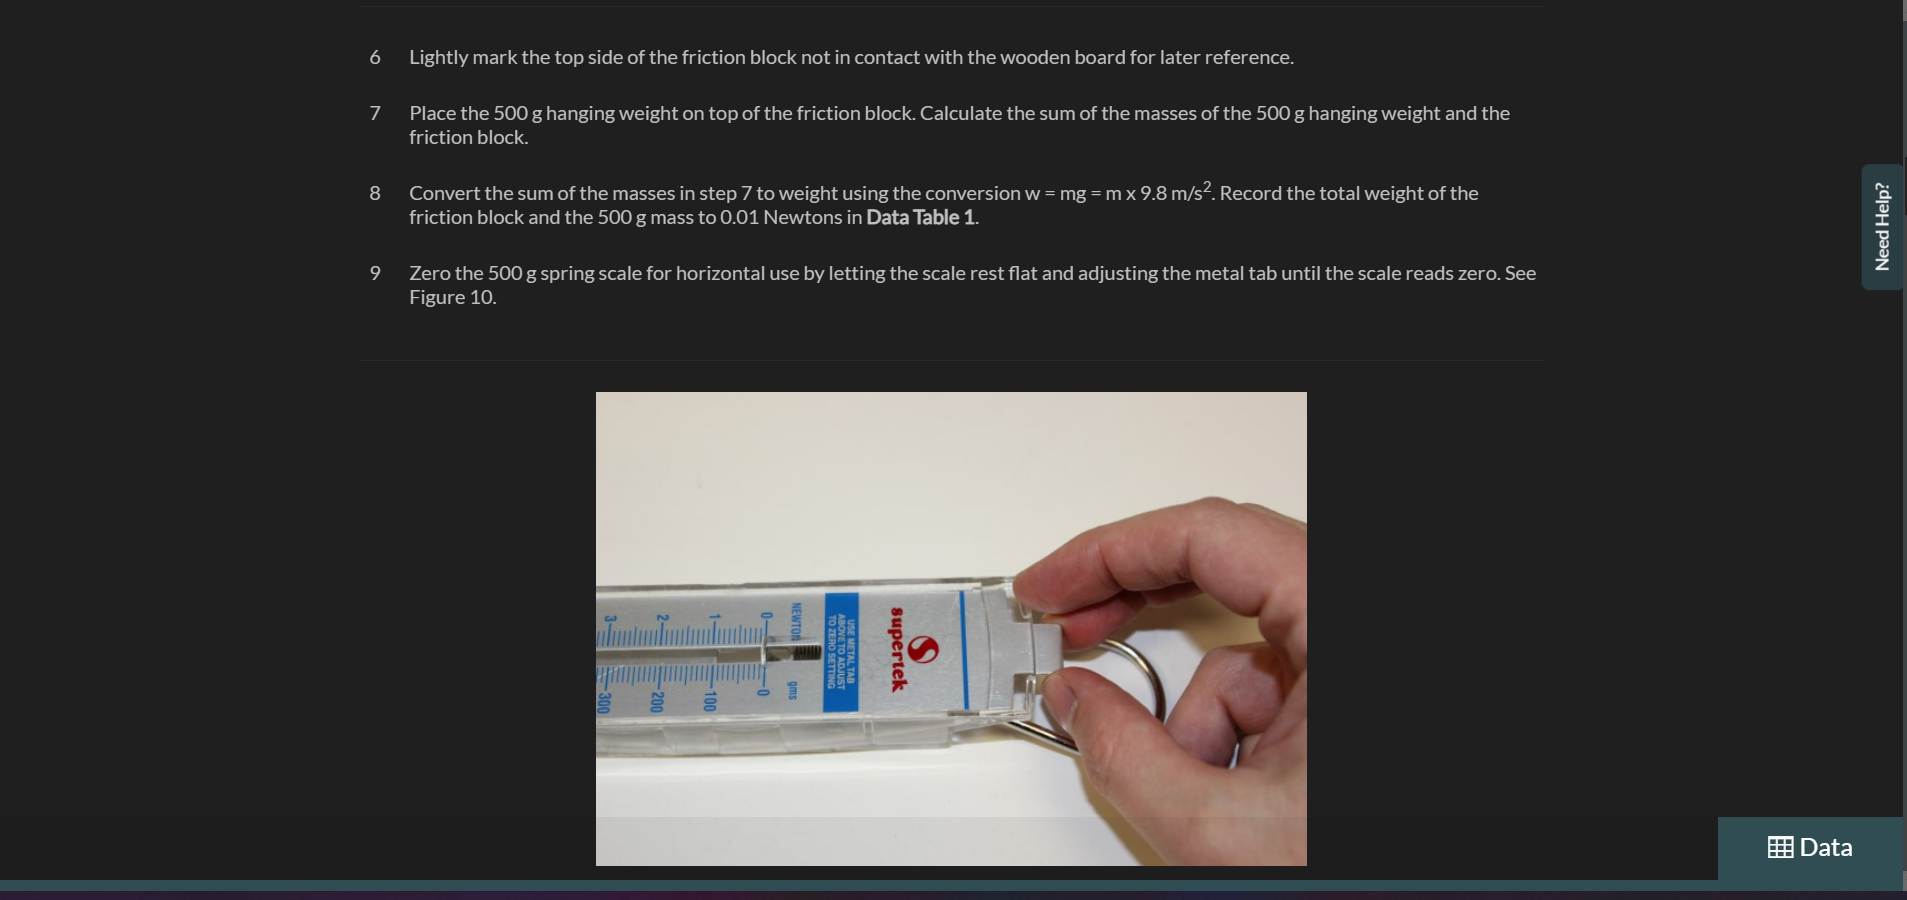
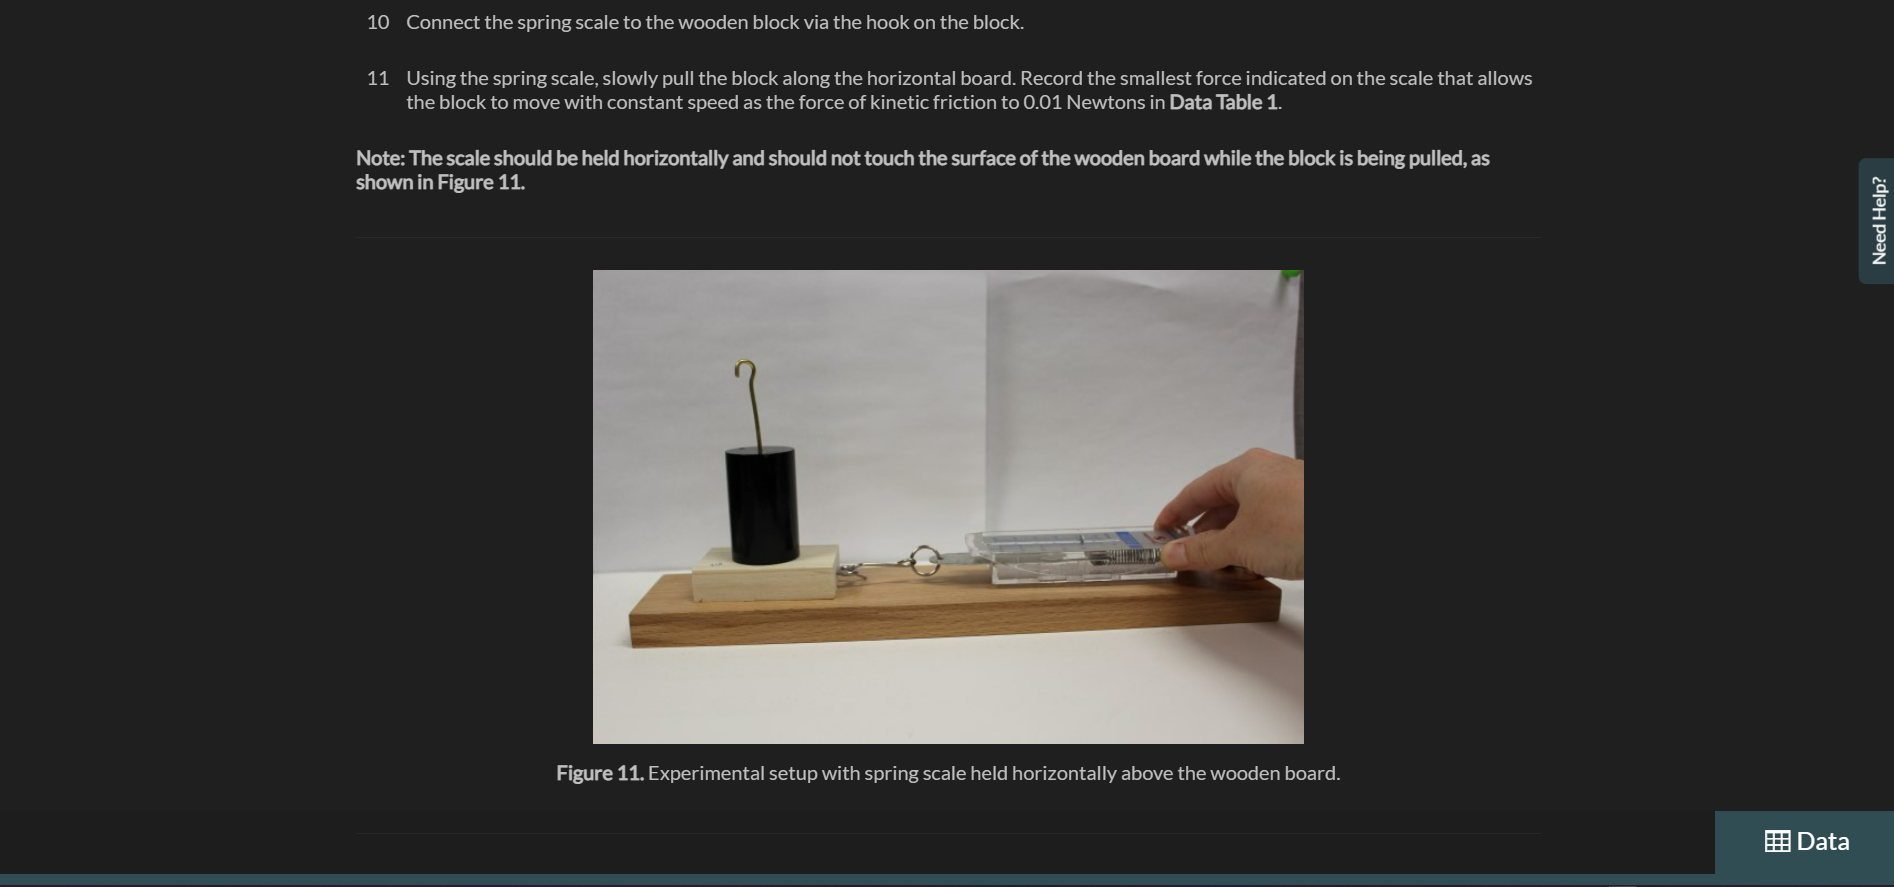
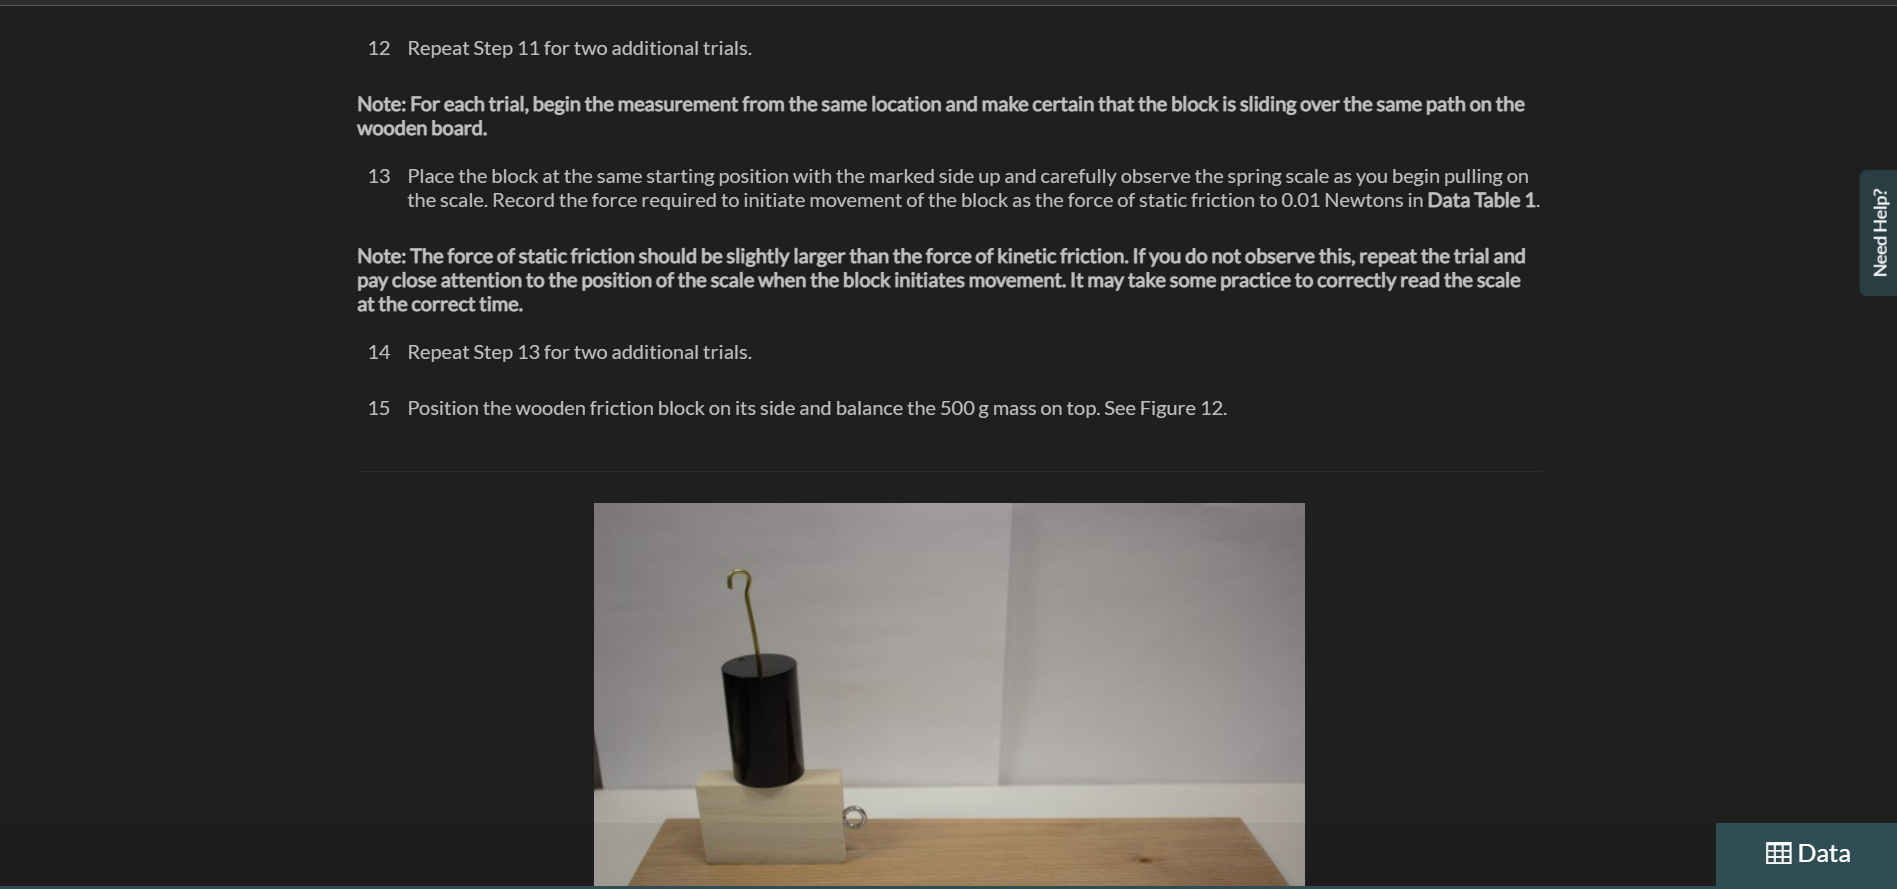


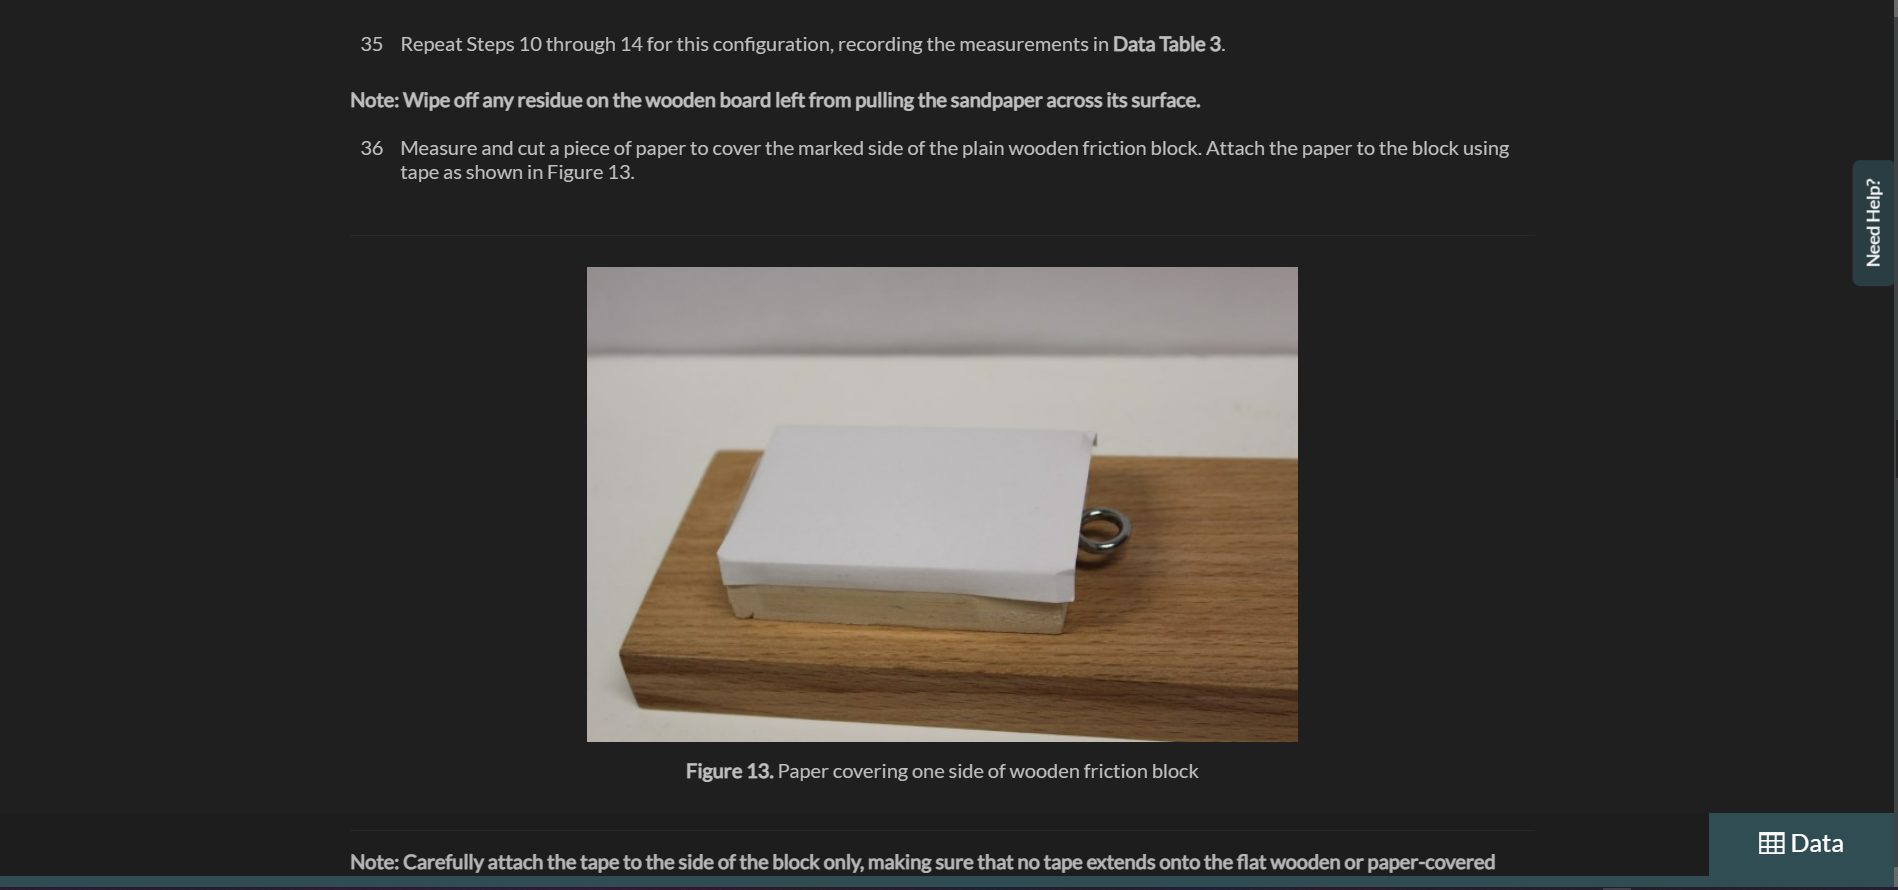

Friction EXPLORATION EXPERIMENTATION EVALUATION Exercise 1 Measuring Static and Kinetic Friction Need Help? In this exercise you will measure the forces and coefficients of static and kinetic friction using a wooden board and friction block together with a known applied force measured with a spring scale. Procedure Part 1: Dependence of Friction on Surface Area 1 Gather the materials needed for this experiment: the wooden board, spring scale, friction block set, 50 g mass, 100 g mass, 500 g mass, precision digital scale, protractor, string and plumb bob weight, and safety goggles. 2 Put on your safety goggles. 3 Place the wooden board on a flat surface. Note: View the video, Using the Digital Scale, before continuing the procedures. If needed, a descriptive text transcript is available. DataDMEGA VICNI 1529 LL OZL ORI COPI OSH 1 170 1 180 091 o/2 ole Need Help? OL 0 6 0 8 OPL | OCI | 021 | 011 | 00 Figure 14. Measuring angle of repose with protractor. 45 Repeat Step 44 for two additional trials, recording the measurements in Data Table 4. 46 Place the friction block with the glass surface glass-side down in the starting position on the wooden board. 47 Repeat Steps 44 and 45 for the glass surface. 48 Place the friction block with the sandpaper surface sandpaper-side down in the starting position on the wooden board. Data45 Repeat Step 44 for two additional trials, recording the measurements in Data Table 4. 46 Place the friction block with the glass surface glass-side down in the starting position on the wooden board. 47 Repeat Steps 44 and 45 for the glass surface. 48 Place the friction block with the sandpaper surface sandpaper-side down in the starting position on the wooden board. Need Help? 49 Repeat Steps 44 and 45 for the sandpaper surface. 50 Place the friction block with the paper surface paper-side down in the starting position on the wooden board. 51 Repeat Steps 44 and 45 for the paper surface. 52 Calculate the average maximum angle of repose found for each of the four surfaces and record these averages to 0.1 degree in Data Table 4. 53 Calculate the percent difference between the predicted maximum angle of repose determined in step 42 for each block surface material and the average measured maximum angle of repose for each material using the percent difference equation below and record the percentage to the nearest one percent in Data Table 4. (Calculated angle - Measured angle) Percent Difference = x 100% (Calculated angle + Measured angle) 2 DataExperiment 1 Data Table 1 Data Table 2 Graph 1 Graph 2 Data Table 3 BE Data Table 4 Exercise 1 Need Help? Data Table 1: Friction and Surface Area Mass Weight (N) Fk Trial 1 (N) Fk Trial 2 (N) Fk Trial 3 (N) Average Fk (N) HK 36.3 g Flat 5.26 1.35 1.45 1.40 1.40 0.27 Side 5.26 1.40 1.35 1.40 1.38 0.26 Weight (N) Fs Trial 1 (N) Fs Trial 2 (N) Fs Trial 3 (N) Average Fs (N) Hs Flat 5.26 1.95 2.05 2.10 2.03 0.39 Side 5.26 1.85 1.90 1.75 1.83 0.35. . Experiment 1 BE Data Table 1 Data Table 2 Graph 1 Graph 2 BE Data Table 3 Data Table 4 Exercise 1 Need Help? Data Table 2: Friction and Normal Force Weight (N) Fk Trial 1 (N) Fk Trial 2 (N) Fk Trial 3 (N) Average Fk (N) HK calc. HK calc. avg. HK graph 5.26 1.35 1.45 1.40 1.40 0.27 0.25 0.24 1.34 0.30 0.35 0.35 0.33 0.25 1.83 0.40 0.45 0.40 0.42 0.23 Weight (N) Fs Trial 1 (N) Fs Trial 2 (N) Fs Trial 3 (N) Average Fs (N) Hs calc. Hs calc. avg. Hs graph 5.26 1.95 2.05 2.10 2.03 0.39 0.47 0.49 1.34 0.75 0.70 0.75 0.73 0.55 1.83 0.85 0.90 0.90 0.88 0.48Data Table 2 BE Data Table 3 Exercise 1 Experiment 1 Data Table 1 Graph 1 Graph 2 Data Table 4 Need Help? D Graph 1: Static Friction + Upload an imageExperiment 1 Data Table 1 Data Table 2 Graph 1 Graph 2 BE Data Table 3 BE Data Table 4 Exercise 1 Need Help? Graph 2: Kinetic Friction Upload an imageExperiment 1 BE Data Table 1 BE Data Table 2 Graph 1 P Graph 2 BE Data Table 3 Data Table 4 Exercise 1 Need Help? Data Table 3: Friction and Surface Material Material Weight (N) Fk Trial 1 (N) Fk Trial 2 (N) Fk Trial 3 (N) Average Fk (N) HK Wood Glass Sandpaper Paper Weight (N) Fs Trial 1 (N) Fs Trial 2 (N) Fs Trial 3 (N) Average Fs (N) Wood Glass Sandpaper Paper. . . Experiment 1 Data Table 1 Data Table 2 Graph 1 Graph 2 BE Data Table 3 BEE Data Table 4 Exercise 1 Need Help? Data Table 4: Maximum Angle of Repose Material e () calc. e () Trial 1 e () Trial 2 e () Trial 3 e () Average % Difference Wood Glass Sandpaper PaperExercise 1 - Questions Question 1 Explain the difference between static friction and kinetic friction. Need Help? B 1 U E T 2 75 Word(s) Static friction results from the irregularities between two surfaces in contact. It is the force acting on an object to keep it at rest. On the other hand, kinetic friction results due to relative motion between two surfaces in contact over a range of speeds. Usually, the kinetic friction is less than the static friction which means it is difficult to move an object from rest than to keep an already moving object in motion. Question 2 Discuss the relationship between friction, normal force, and surface area. B 1 U E 27 Word(s) Force of friction = uN u= coefficient of friction N= normal force So friction force is directly proportional to normal force and is independent of contact surface area Question 3 DataQuestion 3 Compare the static and kinetic friction forces and coefficients determined for the flat wooden friction block and the wooden friction block on its side that were recorded in Data Table 1. What was the relationship of surface area to the force and coefficient of friction between the objects? B U E E T2 T 2 107 Word(s) avg (us) > avg (uk) Relationship between the normal force and the forces and coefficient of friction. When we multiply uk with normal force means weight of the body we are getting values approx nearer to kinetic friction (avg). e.g. W= 5.26N uk= 0.27 So, ukw=5.26*0.27=1.4202 & avg, fk=1.40 so, fk=ukw Similarly, when we multiply weight with lbs we will get values nearer to static friction. Hence, fk= ukw fs= usw4 Place the plain wooden block from the friction block set on the digital scale and record the mass to the nearest 0.1 gin Data Table 1. 5 Place the plain wooden block flat on the wooden board near one end. See Figure 9. Need Help? Figure 9. Wooden board with friction block on top. 6 Lightly mark the top side of the friction block not in contact with the wooden board for later reference. Data 7 Place the 500 g hanging weight on top of the friction block. Calculate the sum of the masses of the 500 g hanging weight and theQuestion 4 Compare the forces of static and kinetic friction and the coefficients of static and kinetic friction that were determined for the flat wooden friction block as the weight (and normal force) of the block changed, as recorded in Data Table 2. What was the relationship between the normal force and the forces and coefficients of friction between the two materials? B 1 U E Tz 215 Word(s) Average force of kinetic friction- FK= 0.42N SO we have, FK/Fs = 0.42/0.88 => FK/Fs =0.4773 or 0.47 and calculated uk = 0.23 calculated us= 0.48 So we have, uk/us = 0.23/0.48 => uk/us = 0.4792 or 0.47 Again as expected, FK/Fs = uk/us = 0.47 The normal force (N) (in our case weight), force of static friction (Fs) and coefficient of static friction (us) are related as: FS= usN and, the normal force (N), force of kinetic friction (Fk) and coefficient of kinetic friction (uk) are related as FK=ukNQuestion 5 Do your experimental results support the background statement that the coefficient of kinetic friction is always smaller than the coefficient of static friction for the same two materials? Explain your answer by referencing your data and graphs. B 1 U EE IE Tz 0 Word(s) Question 6 Compare the average coefficients of static and kinetic friction found for the wooden friction block to the coefficient of static and kinetic friction found from the graph. Do the values match? If not, which method provides a more accurate calculation of the actual coefficient? Explain your choice. B 1 U E E T? T 2 0 Word(s)Question 7 Which material among the four you tested has the largest coefficients of static and kinetic friction? Which material has the smallest? Does this make sense? Why or why not? B I U E E T 2 72 Word(s) Among the 4 materials that were tested, sandpaper had the largest coefficient of static and kinetic friction. The glass box had the smallest coefficient of static and kinetic friction. This makes sense because friction between 2 mating surfaces depends upon the surface roughness of the mating parts. Sand paper has the most rough surface hence it will result in more friction, whereas glass has the most smooth surface resulting in less friction. Question 8 When attempting to determine the coefficient of kinetic friction, why is it necessary to move the block with constant velocity? When attempting to determine the coefficient of static friction, why is it necessary to measure the applied force just before the block moves? Are these two scenarios (constant velocity and almost in motion) the only scenarios when friction is present? Explain your answer. B 1 U E T 2 T 2 273 Word(s) u= coefficient of kinetic friction. When determining the static friction we need to measure the force applied just before the movement of block starts. Because when the block is at rest there exists the static friction which is more in amount than kinetic friction. So in order to move the block we have to break this static friction barrier, and the maximum amount of force which we have to apply will be exactly equal to the static friction force. So we need to calculate the force just on the verge of motion.Question 8 When attempting to determine the coefficient of kinetic friction, why is it necessary to move the block with constant velocity? When attempting to determine the coefficient of static friction, why is it necessary to measure the applied force just before the block moves? Are these two scenarios (constant velocity and almost in motion) the only scenarios when friction is present? Explain your answer. B U E T 2 273 Word(s) u= coefficient of kinetic friction. When determining the static friction we need to measure the force applied just before the movement of block starts. Because when the block is at rest there exists the static friction which is more in amount than kinetic friction. So in order to move the block we have to break this static friction barrier, and the maximum amount of force which we have to apply will be exactly equal to the static friction force. So we need to calculate the force just on the verge of motion. Then F (applied) = Fs (static friction) = (Us) Mg Us= coefficient of static friction Just after the motion starts there will be no static friction but kinetic friction. So we have to find the friction at the verge of motion. However, there are not the only 2 cases when friction is present. Kinetic friction is always present whenever there is a motion, weather constant velocity or with acceleration. On the other hand, static friction is present until block starts moving but we can find it only at the verge of motion because only in that condition the amount of force will be just enough to break the static friction.6 Lightly mark the top side of the friction block not in contact with the wooden board for later reference. 7 Place the 500 g hanging weight on top of the friction block. Calculate the sum of the masses of the 500 g hanging weight and the friction block. 8 Convert the sum of the masses in step 7 to weight using the conversion w = mg = m x 9.8 m/s2. Record the total weight of the friction block and the 500 g mass to 0.01 Newtons in Data Table 1 Need Help? 9 Zero the 500 g spring scale for horizontal use by letting the scale rest flat and adjusting the metal tab until the scale reads zero. See Figure 10. NEWTON supertek TO ZERO SETTING USE METAL TAB BOVE TO ADJUST Data10 Connect the spring scale to the wooden block via the hook on the block. 11 Using the spring scale, slowly pull the block along the horizontal board. Record the smallest force indicated on the scale that allows the block to move with constant speed as the force of kinetic friction to 0.01 Newtons in Data Table 1. Note: The scale should be held horizontally and should not touch the surface of the wooden board while the block is being pulled, as shown in Figure 11. Need Help? Figure 11. Experimental setup with spring scale held horizontally above the wooden board. Data12 Repeat Step 11 for two additional trials. Note: For each trial, begin the measurement from the sa rne location and make certain that the block is sliding over the same path on the wooden board. 13 Place the block at the same starting position with the marked side up and carefully observe the spring scale as you begin pulling on the scale. Record the force required to initiate movement of the block as the force of staticfriction to 0.01 Newtons in Data Table 1. Note: The force of static friction should be slightly larger than the force of kinetic friction. Ifyou do not observe this, repeat the trial and pay close attention to the position of the scale when the block initiates movement. It may take some practice to correctly read the scale at the correct time 14 Repeat Step 13 for two additional trials. 15 Position the wooden friction block on its side and balance the 500 g mass on too. See Figure 12. Need Help? 16 Repeat Steps 10 through 14 for the block in this position. 17 Calculate the average force of kinetic friction and the average force of static friction for the flat block and the block on its side. Record these values to 0.01 Newtons in Data Table 1. 18 Calculate the coefficient of static and kinetic friction for the flat block and the block on its side using the corresponding average friction forces calculated in Step 17. Record these values in Data Table 1. Need Help? Note: As illustrated in the background, the coefficient of static friction is: Fspring,s FN Part 2: Dependence of Friction on Normal Force 19 Copy the total weight, average friction force, and friction coefficient data for the 500 g mass from Data Table 1 into Data Table 2. 20 Return the friction block to the flat side with the marked side up at the starting position on the wooden board. Place the 100 g hanging weight on the friction block and record the total weight to 0.01 Newtons in Data Table 2. 21 Repeat Steps 10 through 14, recording the measurements in Data Table 2. 22 Return the fiction block to the starting position with the marked side up on the wooden board. 23 Place the 50 g hanging mass and the 100 g hanging mass on top of the friction block and record the total weight of the hanging Data masses and friction block to 0.01 Newtons in Data Table 2.24 Repeat Steps 10 through 14, recording the measurements in Data Table 2. 25 Calculate the average static and kinetic friction forces for each weight measured and record the values to 0.01 Newtons in Data Table 2. 26 Calculate the coefficient of static and kinetic friction for each weight using the average friction forces calculated in Step 25 and record to 0.01 precision in Data Table 2. Need Help? 27 Calculate the average coefficient of static and kinetic friction and record to 0.01 precision in Data Table 2. 28 Create a graph of average static friction force on the vertical axis versus normal force on the horizontal axis using graphing software. Include the point (0,0) in your data. Include a graph title, axes titles with units, and a trendline with the equation shown. Upload an image of the graph to Graph 1. Add the static friction coefficient determined from the trendline to 0.01 precision to Data Table 2. 29 Repeat Step 28 for the kinetic friction force, uploading an image of the graph to Graph 2. Part 3: Dependence of Friction on Surface Material 30 Choose the total weight for the friction block that produced the most consistent results and copy all this data from Data Table 2 to Data Table 3 31 Use the digital scale to measure the mass of the friction block with sandpaper and glass covering its sides. Record the total weight of this block and the chosen hanging mass from Step 30 to 0.01 Newtons in Data Table 3. 32 Place the friction block glass-side down on the wooden board at the starting position used in previous trials. 33 Repeat Steps 10 through 14 for this configuration, recording the measurements in Data Table 3. 34 Rotate the friction block so the sandpaper side is in contact with the wooden board and return to the starting position. Data35 Repeat Steps 10 through 14 for this conguration. recording the measurements in Data Table 3. Note: Wipe off any residue on the wooden board left from pulling the sandpaper across its surface. 36 Measure and cut a piece of paper to cover the marked side of the plain wooden friction block. Attach the paper to the block using tape as shown in Figure 13. \"a a: I B a 2 Figure 13. Paper covering one side of wooden friction block Note: Carefully attach the tape to the side of the block only, making sure that no tape extends onto the at wooden or paper-covered Note: Carefully attach the tape to the side of the block only, making sure that no tape extends onto the flat wooden or paper-covered side. 37 Record the weight of the friction block with paper attached plus the hanging weight to 0.01 Newtons in Data Table 3. 38 Place the friction block paper-side down on the wooden board in the starting position. 39 Repeat Steps 10 through 14 for this configuration, recording the measurements in Data Table 3. Need Help? 40 Calculate the average force of static and kinetic friction for the glass on wood measurements, the sandpaper on wood measurements, and the paper on wood measurements. Record these values to 0.01 Newtons in Data Table 3. 41 Calculate the coefficient of static and kinetic friction for the glass on wood measurements, the sandpaper on wood measurements, and the paper on wood measurements as in Step 18. Record these values to 0.01 precision in Data Table 3. Part 4: Experimental Verification of Static Friction Coefficient 42 Calculate the maximum angle of repose for the wooden friction block, the glass friction block, the sandpaper friction block, and the paper-covered friction block using the coefficient of static friction determined for each surface in Part 3. Use the equation below, as illustrated in the background. Record the angle to 0.1 degree in Data Table 4. 43 Place the wooden friction block on the wooden board in the starting position with the same side down as was used in Part 1 and Part 2. Data 44 Slowly raise one end of the wooden board until the friction block just starts to slide. Hold the board at this angle and measure the
Step by Step Solution
There are 3 Steps involved in it

Get step-by-step solutions from verified subject matter experts