

Question: 1. Complete each data table. a) Fix A = 10 cm, k = smallest b) Fix M = 100 g, k = smallest c) Fix
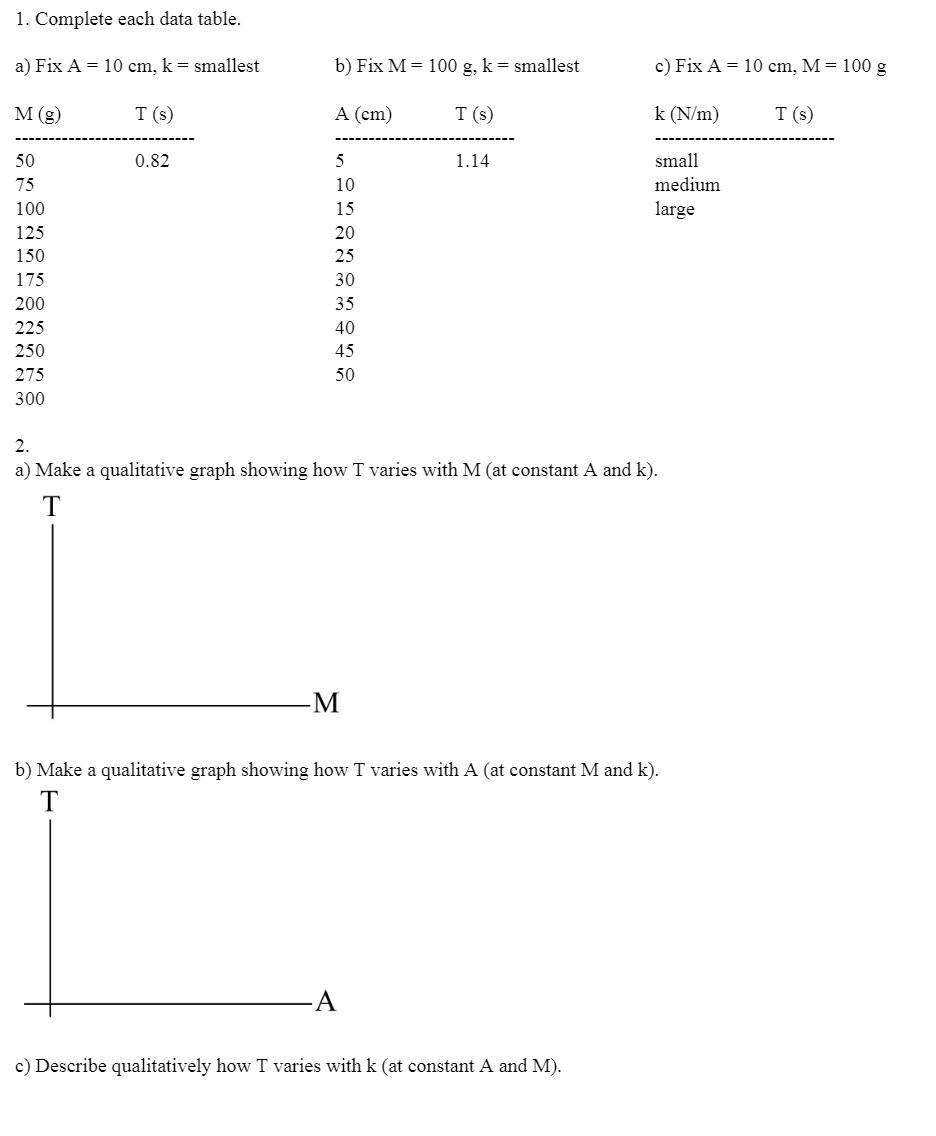
1. Complete each data table. a) Fix A = 10 cm, k = smallest b) Fix M = 100 g, k = smallest c) Fix A = 10 cm, M = 100 g M (g) T (s) A (cm) T (s) k (N/m) T (s) 50 0.82 5 1.14 small 75 10 medium 100 15 large 125 20 150 25 175 30 200 35 225 40 250 45 275 50 300 2. a) Make a qualitative graph showing how T varies with M (at constant A and k). T M b) Make a qualitative graph showing how T varies with A (at constant M and k). T A c) Describe qualitatively how T varies with k (at constant A and M)
Step by Step Solution
There are 3 Steps involved in it
1 Expert Approved Answer
Step: 1 Unlock

Question Has Been Solved by an Expert!
Get step-by-step solutions from verified subject matter experts
Step: 2 Unlock
Step: 3 Unlock