

Question: Instructions: Using the Excel Financial Forecast worksheet from Assignment #1, determine the 'sensitivity' of the model by adjusting the values of growth rate in sales
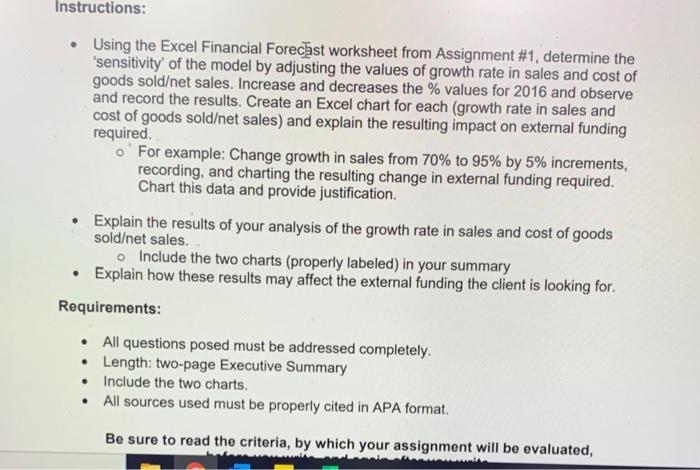
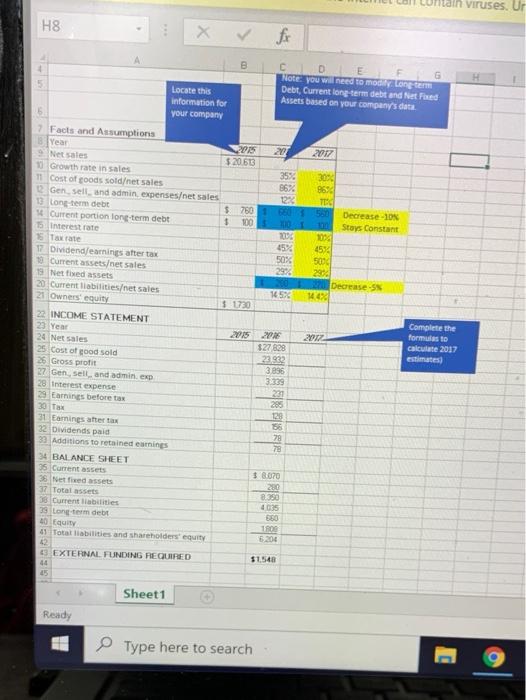
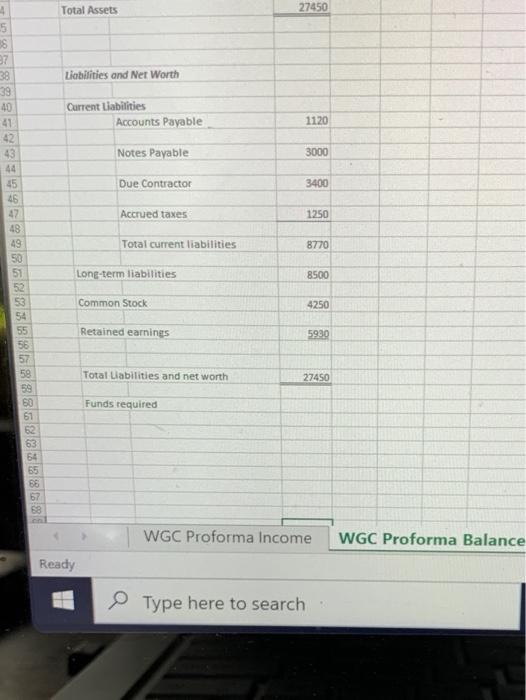
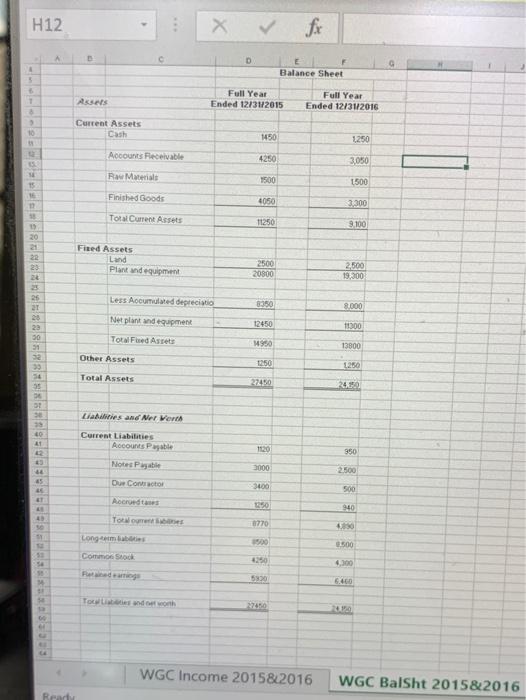
Instructions: Using the Excel Financial Forecast worksheet from Assignment #1, determine the 'sensitivity' of the model by adjusting the values of growth rate in sales and cost of goods soldet sales. Increase and decreases the % values for 2016 and observe and record the results. Create an Excel chart for each (growth rate in sales and cost of goods soldet sales) and explain the resulting impact on external funding required. o For example: Change growth in sales from 70% to 95% by 5% increments, recording, and charting the resulting change in external funding required. Chart this data and provide justification. Explain the results of your analysis of the growth rate in sales and cost of goods soldet sales. o Include the two charts (properly labeled) in your summary Explain how these results may affect the external funding the client is looking for. Requirements: All questions posed must be addressed completely. Length: two-page Executive Summary Include the two charts. All sources used must be properly cited in APA format. Be sure to read the criteria, by which your assignment will be evaluated, lain viruses. Ur H8 86% B CD E G Note you will need to mody Long term Locate this Debt, Current long term debt and Net Fixed information for Assets based on your company's data your company 7 Facts and Assumptions Year 2015 2017 Net sales $20.653 Growth rate in sales 35. 30% 11 Cost of goods soldet sales 8630 Gen sell and admin expenseset sales 12% TE 1 long term debt $ 7601 PO 550 Decrease -10% Current portion long-term debt 1 100 101 100 Stay Constant 5 Interest rate 20 2004 5 Taxate 45% 4554 1 Dividend/earnings after tax 50% 506 19 Current assetset sales 2904 290 Nettised assets Decreases 20 Current liabilitieset sales 1450 14.00 21 Ownerscout $ 1730 22 INCOME STATEMENT Complete the 20 Year 2015 20 2017 formulas to 20 Net Sales 327 328 calculate 2017 25 Cost of good sold 2299 estimates 26 Gross profit 3.896 27 Gen. sell and admin. exp 3.339 28 Interest Expense 231 29 Earnings before tax 285 30 Tax 129 31 Earnings after tax 58 32 Dividends paid 78 39 Additions to retained earnings 78 34 BALANCE SHEET 35 Current assets $ 8670 36 Net fixed assets 280 37 Total assets 8.390 38 Current abilities 4025 39 Long-term det 30 10 Equity 1800 41 Total liabilities and shareholders equity 5200 42 13 EXTERNAL FUNDING REQUIRED $1.548 44 Sheet1 Ready Type here to search wa Enable ting Cheminst you needed it's safe to stay in Protected View Andrew Cencial O De 2016 - len ny ws w M WA WA WA w 165 55 1995 nyha Chocolate w puter www dhe Apple www PC $52 im Angel Tham Then The Mare Meie CA im Che w NA MYA ys THE New AN GO M hey A M w Geach www M M Miche Mic W.COM HAWA Comany 1 Olt w w ch WWW M A FO 0 che w WAN WEB wowe www.com where www.me www Foto UEF Ford 15 w 5 Free win 1 She in IR w ww in UN aby - Data Soesty Rep Final Prvot Table Diagram Source 16V Type here to search 90F Mostly sunny 2:30 PM 7/16/20 HEWLETT-PACKARD File Home Insert Draw Page Layout Formulas Data Review PROTECTED VIEW Be careful--files from the Internet can contain viruses. Unless you need t D69 fx C F G X Actual 9/30/2017 Proforma Ended 12/31/2017 Ass Dance unge Current Assets Cash 1450 Arbutieceable 4250 Raw Materials 1500 Finished Goods 4050 1 Total Current Assets 11250 21 dets Land Plant and equipment 3500 2000 Les Accumulated depreciation KUO Net plant and equipment 12450 Total Fixed Assets 19950 Other Art 1250 Total Ass 2100 this and Net Worth 1 Contabi Rounts Payable 1120 Notes abi 1000 Dun Contractor 500 Acred cases 1250 Totalmente 8770 WGC Proforma Income WGC Proforma Balance Sheet Ready Type here to search HE 4 Total Assets 27450 Liabilities and Net Worth Current Liabilities Accounts Payable 1120 Notes Payable 3000 Due Contractor 3400 Accrued taxes 1250 39 39 40 41 42 43 44 45 46 47 48 49 50 51 52 53 54 55 56 57 58 59 60 61 Total current liabilities 8770 Long-term liabilities 8500 Common Stock 4250 Retained earnings 5930 Total Liabilities and net worth 27450 Funds required 63 54 65 66 67 59 WGC Proforma Income WGC Proforma Balance Ready Type here to search H12 X fix A E C D G F Balance Sheet 1 Acces Full Year Ended 12/31/2015 Full Year Ended 12/31/2016 3 10 Current Assets Cash 1450 1.250 Accounts Receivable 4250 3050 Raw Materials 1500 1500 15 TE Finished Goods 4050 3.300 18 TotalCurrent Assets 11250 9.100 30 21 22 23 Fixed Assets Land Plant dequipment 2500 20800 2,500 19,300 Less Accumulated depreciatio 8.350 8.000 Net plant and equipment 12450 10300 26 21 28 29 30 51 32 39 54 35 Total Fed Art 1980 13800 Other Assets 1250 1250 Total Assets 2740 24,00 Ladies and Mer Vert 29 40 11 Current Liabilities Accounts Payable 1120 950 Notes Payable 43 40 45 2000 2.500 D Concor 3400 500 Accruedas 940 0770 Toto Long.com Comme Stock 500 8500 18 4,300 590 Tocando 2010 WGC Income 2015/2016 WGC Balsht 2015&2016 Ready Instructions: Using the Excel Financial Forecast worksheet from Assignment #1, determine the 'sensitivity' of the model by adjusting the values of growth rate in sales and cost of goods soldet sales. Increase and decreases the % values for 2016 and observe and record the results. Create an Excel chart for each (growth rate in sales and cost of goods soldet sales) and explain the resulting impact on external funding required. o For example: Change growth in sales from 70% to 95% by 5% increments, recording, and charting the resulting change in external funding required. Chart this data and provide justification. Explain the results of your analysis of the growth rate in sales and cost of goods soldet sales. o Include the two charts (properly labeled) in your summary Explain how these results may affect the external funding the client is looking for. Requirements: All questions posed must be addressed completely. Length: two-page Executive Summary Include the two charts. All sources used must be properly cited in APA format. Be sure to read the criteria, by which your assignment will be evaluated, lain viruses. Ur H8 86% B CD E G Note you will need to mody Long term Locate this Debt, Current long term debt and Net Fixed information for Assets based on your company's data your company 7 Facts and Assumptions Year 2015 2017 Net sales $20.653 Growth rate in sales 35. 30% 11 Cost of goods soldet sales 8630 Gen sell and admin expenseset sales 12% TE 1 long term debt $ 7601 PO 550 Decrease -10% Current portion long-term debt 1 100 101 100 Stay Constant 5 Interest rate 20 2004 5 Taxate 45% 4554 1 Dividend/earnings after tax 50% 506 19 Current assetset sales 2904 290 Nettised assets Decreases 20 Current liabilitieset sales 1450 14.00 21 Ownerscout $ 1730 22 INCOME STATEMENT Complete the 20 Year 2015 20 2017 formulas to 20 Net Sales 327 328 calculate 2017 25 Cost of good sold 2299 estimates 26 Gross profit 3.896 27 Gen. sell and admin. exp 3.339 28 Interest Expense 231 29 Earnings before tax 285 30 Tax 129 31 Earnings after tax 58 32 Dividends paid 78 39 Additions to retained earnings 78 34 BALANCE SHEET 35 Current assets $ 8670 36 Net fixed assets 280 37 Total assets 8.390 38 Current abilities 4025 39 Long-term det 30 10 Equity 1800 41 Total liabilities and shareholders equity 5200 42 13 EXTERNAL FUNDING REQUIRED $1.548 44 Sheet1 Ready Type here to search wa Enable ting Cheminst you needed it's safe to stay in Protected View Andrew Cencial O De 2016 - len ny ws w M WA WA WA w 165 55 1995 nyha Chocolate w puter www dhe Apple www PC $52 im Angel Tham Then The Mare Meie CA im Che w NA MYA ys THE New AN GO M hey A M w Geach www M M Miche Mic W.COM HAWA Comany 1 Olt w w ch WWW M A FO 0 che w WAN WEB wowe www.com where www.me www Foto UEF Ford 15 w 5 Free win 1 She in IR w ww in UN aby - Data Soesty Rep Final Prvot Table Diagram Source 16V Type here to search 90F Mostly sunny 2:30 PM 7/16/20 HEWLETT-PACKARD File Home Insert Draw Page Layout Formulas Data Review PROTECTED VIEW Be careful--files from the Internet can contain viruses. Unless you need t D69 fx C F G X Actual 9/30/2017 Proforma Ended 12/31/2017 Ass Dance unge Current Assets Cash 1450 Arbutieceable 4250 Raw Materials 1500 Finished Goods 4050 1 Total Current Assets 11250 21 dets Land Plant and equipment 3500 2000 Les Accumulated depreciation KUO Net plant and equipment 12450 Total Fixed Assets 19950 Other Art 1250 Total Ass 2100 this and Net Worth 1 Contabi Rounts Payable 1120 Notes abi 1000 Dun Contractor 500 Acred cases 1250 Totalmente 8770 WGC Proforma Income WGC Proforma Balance Sheet Ready Type here to search HE 4 Total Assets 27450 Liabilities and Net Worth Current Liabilities Accounts Payable 1120 Notes Payable 3000 Due Contractor 3400 Accrued taxes 1250 39 39 40 41 42 43 44 45 46 47 48 49 50 51 52 53 54 55 56 57 58 59 60 61 Total current liabilities 8770 Long-term liabilities 8500 Common Stock 4250 Retained earnings 5930 Total Liabilities and net worth 27450 Funds required 63 54 65 66 67 59 WGC Proforma Income WGC Proforma Balance Ready Type here to search H12 X fix A E C D G F Balance Sheet 1 Acces Full Year Ended 12/31/2015 Full Year Ended 12/31/2016 3 10 Current Assets Cash 1450 1.250 Accounts Receivable 4250 3050 Raw Materials 1500 1500 15 TE Finished Goods 4050 3.300 18 TotalCurrent Assets 11250 9.100 30 21 22 23 Fixed Assets Land Plant dequipment 2500 20800 2,500 19,300 Less Accumulated depreciatio 8.350 8.000 Net plant and equipment 12450 10300 26 21 28 29 30 51 32 39 54 35 Total Fed Art 1980 13800 Other Assets 1250 1250 Total Assets 2740 24,00 Ladies and Mer Vert 29 40 11 Current Liabilities Accounts Payable 1120 950 Notes Payable 43 40 45 2000 2.500 D Concor 3400 500 Accruedas 940 0770 Toto Long.com Comme Stock 500 8500 18 4,300 590 Tocando 2010 WGC Income 2015/2016 WGC Balsht 2015&2016 Ready
Step by Step Solution
There are 3 Steps involved in it

Get step-by-step solutions from verified subject matter experts