

Question: 1. Complete table 2, based on in table 1 data 2.Complete Table 3 based the following statistics and your results in table 2 (GDP at
1. Complete table 2, based on in table 1 data
2.Complete Table 3 based the following statistics and your results in table 2 (GDP at constant price)
3. A worldwide recession (-4.5%) is expected during 2020 due to Covid-19. Assuming that the UAE experiences the same slowdown as the average for the world, what would be the UAE GDP in constant prices in the year 2020. (1 Mark)
4. Explain the different inflation rates obtained based on the CPI method and the inflation rates based on the GDP deflator method.
5. (Bonus question) Illustrate graphically the GDP fluctuation during the period 2017-2020
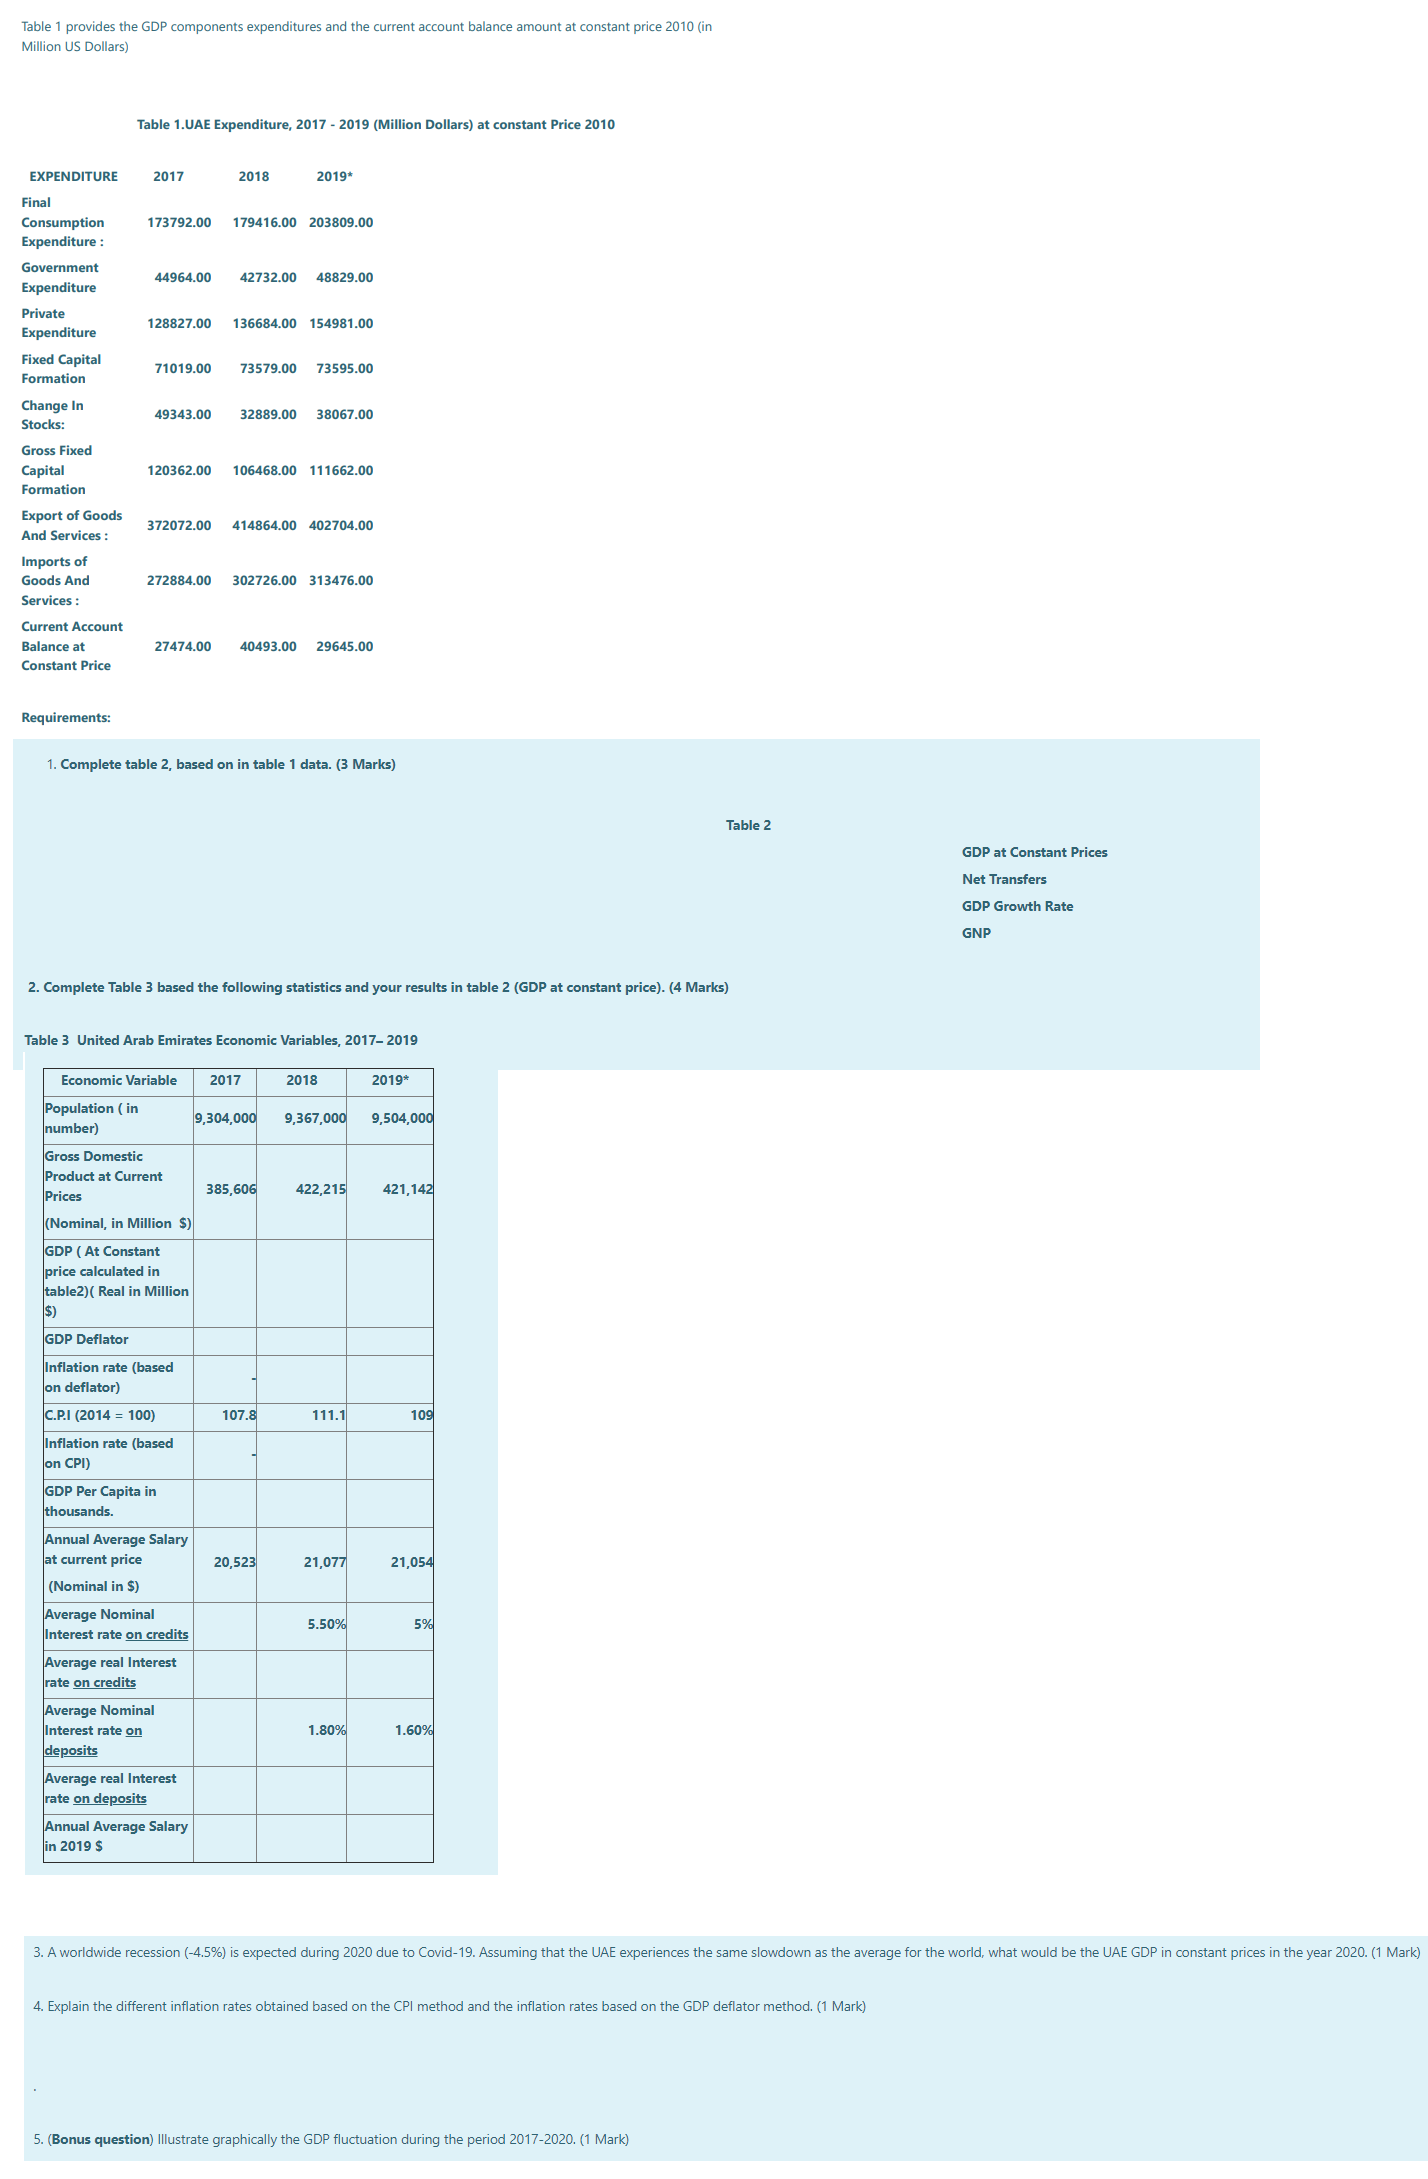
Table 1 provides the GDP components expenditures and the current account balance amount at constant price 2010 (in Million US Dollars) Table 1.UAE Expenditure, 2017 - 2019 (Million Dollars) at constant Price 2010 EXPENDITURE 2017 2018 2019* Final Consumption 173792.00 179416.00 203809.00 Expenditure : Government Expenditure 44964.00 42732.00 48829.00 Private Expenditure 28827.00 136684.00 154981.00 Fixed Capital Formation 71019.00 73579.00 73595.00 Change In 49343.00 32889.00 38067.00 Gross Fixed Capital 120362.00 106468.00 111662.00 Formation Export of Goods And Services : 372072.00 414864.00 402704.00 Imports of Goods And 72884.00 302726.00 313476.00 Services : Current Account Balance at 27474.00 40493.00 29645.00 Constant Price Requirements: 1. Complete table 2, based on in table 1 data. (3 Marks) Table 2 GDP at Constant Prices Net Transfers GDP Growth Rate GNP 2. Complete Table 3 based the following statistics and your results in table 2 (GDP at constant price). (4 Marks) Table 3 United Arab Emirates Economic Variables, 2017-2019 Economic Variable 2017 2018 2019* Population ( in number) 9,304,000 9,367,000 9,504,000 Gross Domestic Product at Current Prices 385,606 422,215 421,142 (Nominal, in Million $) GDP ( At Constant price calculated in table2)( Real in Million $) GDP Deflator Inflation rate (based on deflator) C.P.I (2014 = 100) 107.8 111.1 109 Inflation rate (based on CPI) GDP Per Capita in housands. Annual Average Salary at current price 20,523 21,077 21,054 (Nominal in $) Average Nominal Interest rate on credits 5.50% 5% Average real Interest rate on credits Average Nominal Interest rate on 1.80% 1.60% deposits Average real Interest rate on deposits Annual Average Salary in 2019 $ 3. A worldwide recession (-4.5%) is expected during 2020 due to Covid-19. Assuming that the UAE experiences the same slowdown as the average for the world, what would be the UAE GDP in constant prices in the year 2020. (1 Mark) 4. Explain the different inflation rates obtained based on the CPI method and the inflation rates based on the GDP deflator method. (1 Mark) 5. (Bonus question) Illustrate graphically the GDP fluctuation during the period 2017-2020. (1 Mark)
Step by Step Solution
There are 3 Steps involved in it

Get step-by-step solutions from verified subject matter experts